Bilirubin: Diagnostic Significance and Clinical Insights
Authors: Payal Bhandari M.D., Nigella Umali Ruguian, Madison Granados
Contributors: Vivi Chador, Hailey Chin, Amer Džanković
Key Insights
Bilirubin is a yellow-orange pigment produced when red blood cells (RBCs) break down after about 120 days. White blood cells split RBCs into hemoglobin and iron. Hemoglobin separates into globin, recycled for new proteins, and heme, which becomes bilirubin, excreted in stool or urine. High bilirubin may indicate conditions like liver disease, blood disorders, allergic drug reactions, or bile duct issues, often linked to jaundice and organ toxicity. Low bilirubin may signal metabolic disorders like type 2 diabetes or obesity. Monitoring bilirubin alongside liver tests and blood counts helps assess RBC health and guide treatment.
What is Bilirubin?
Bilirubin is the waste product of red blood cells, with about 25% coming from heme proteins in the liver and muscles. Adults produce around 250 mg of bilirubin daily.
Origin and Formation of Bilirubin
White blood cells break down old or damaged RBCs, releasing toxic components like hemoglobin, free iron, and heme products. Transporter proteins quickly bind the toxic waste and remove it from the bloodstream.
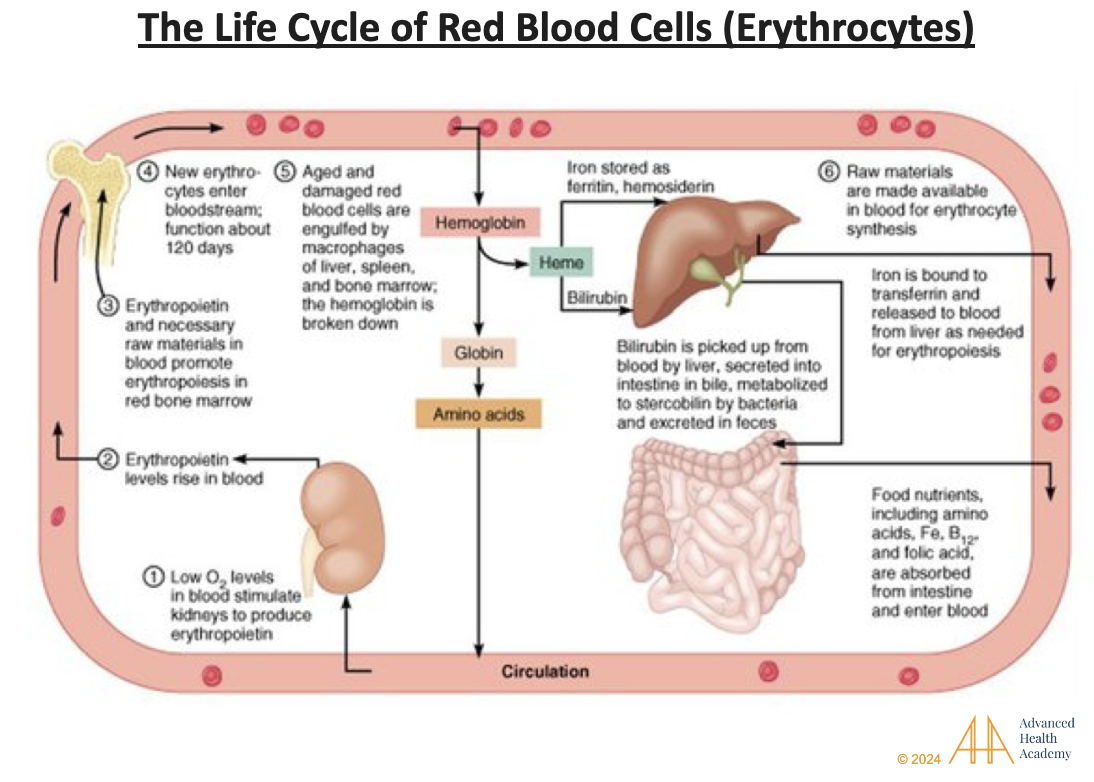
Figure 1: The Life Cycle of Red Blood Cells (Erythrocytes; RBC). Red blood cells (RBCs) use hemoglobin to carry oxygen throughout the body. When oxygen levels are low, the kidneys release erythropoietin (EPO), a hormone that tells the bone marrow to make more RBCs. Old or damaged RBCs are broken down by white blood cells (macrophages) in the liver, spleen, and bone marrow. This process releases hemoglobin and iron, which are quickly cleared from the blood. Heme is turned into biliverdin, sent to the liver, stored as bile in the gallbladder, or removed through stool and urine. Iron is stored in organs or reused to make new RBCs. Globin is recycled into amino acids for the body to use .
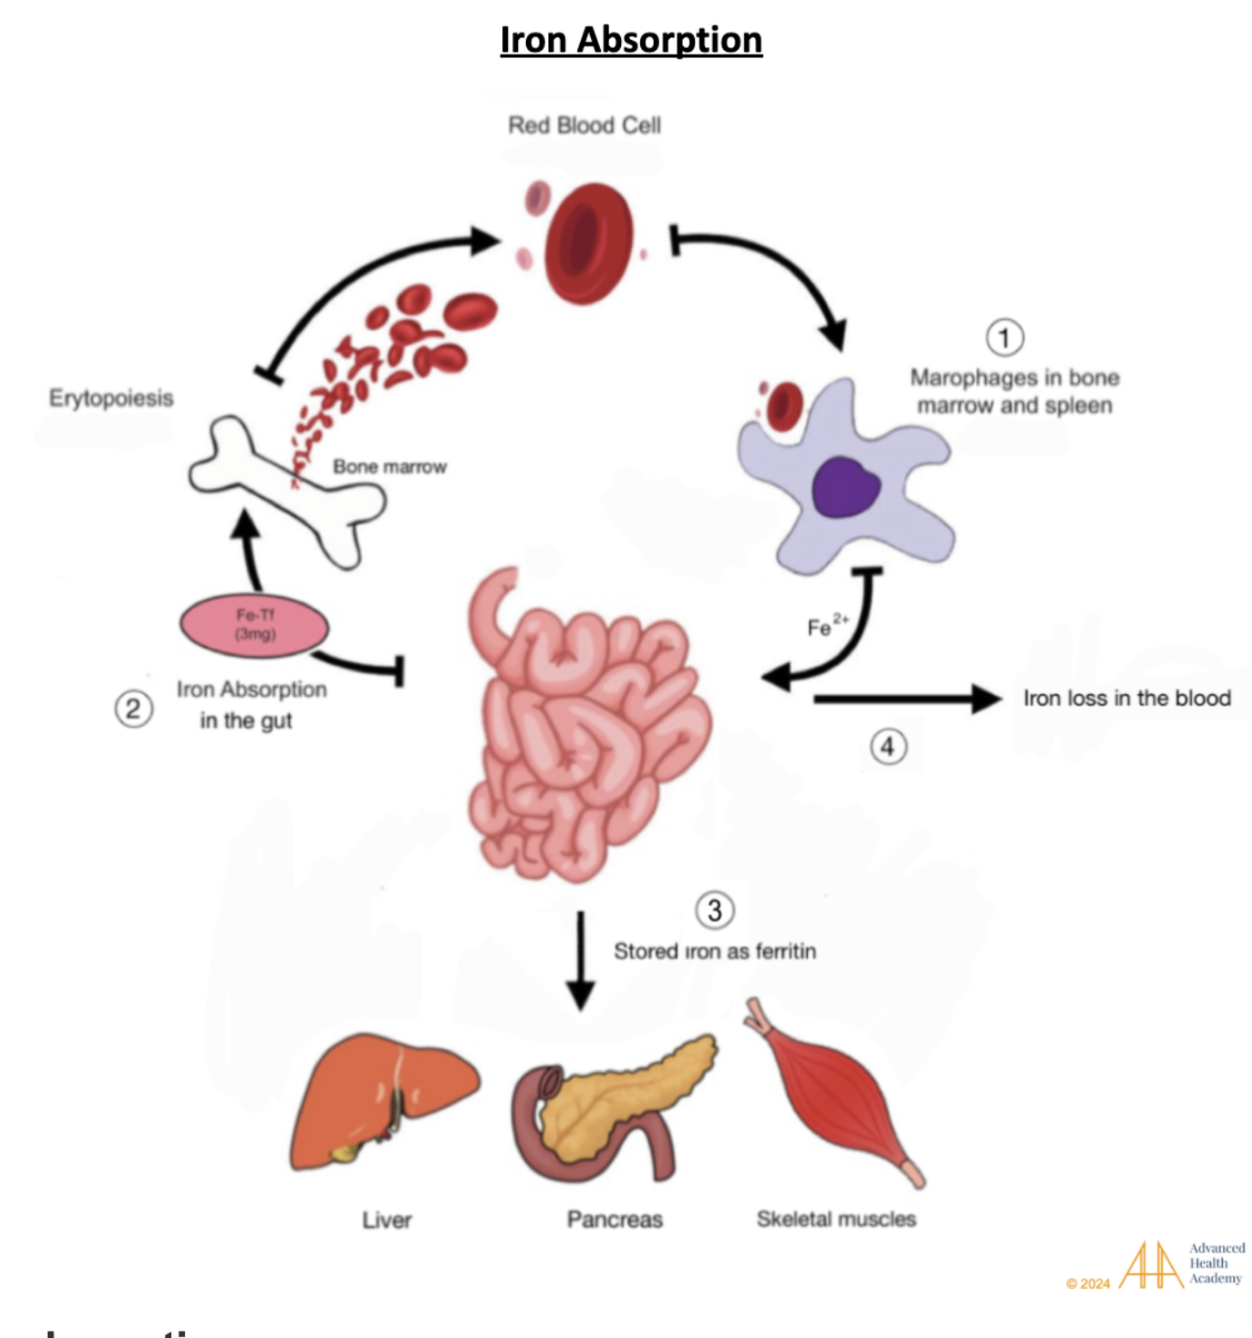
Figure 2: Iron absorption. (1) Old or damaged red blood cells are destroyed by macrophages in the liver, spleen, and bone marrow. (2) Released iron is absorbed in the gut, bound to transferrin, and sent to the bone marrow to make new RBCs. (3) Some iron is stored as ferritin in the liver, pancreas, and muscles, (4) while a small amount stays in the blood .
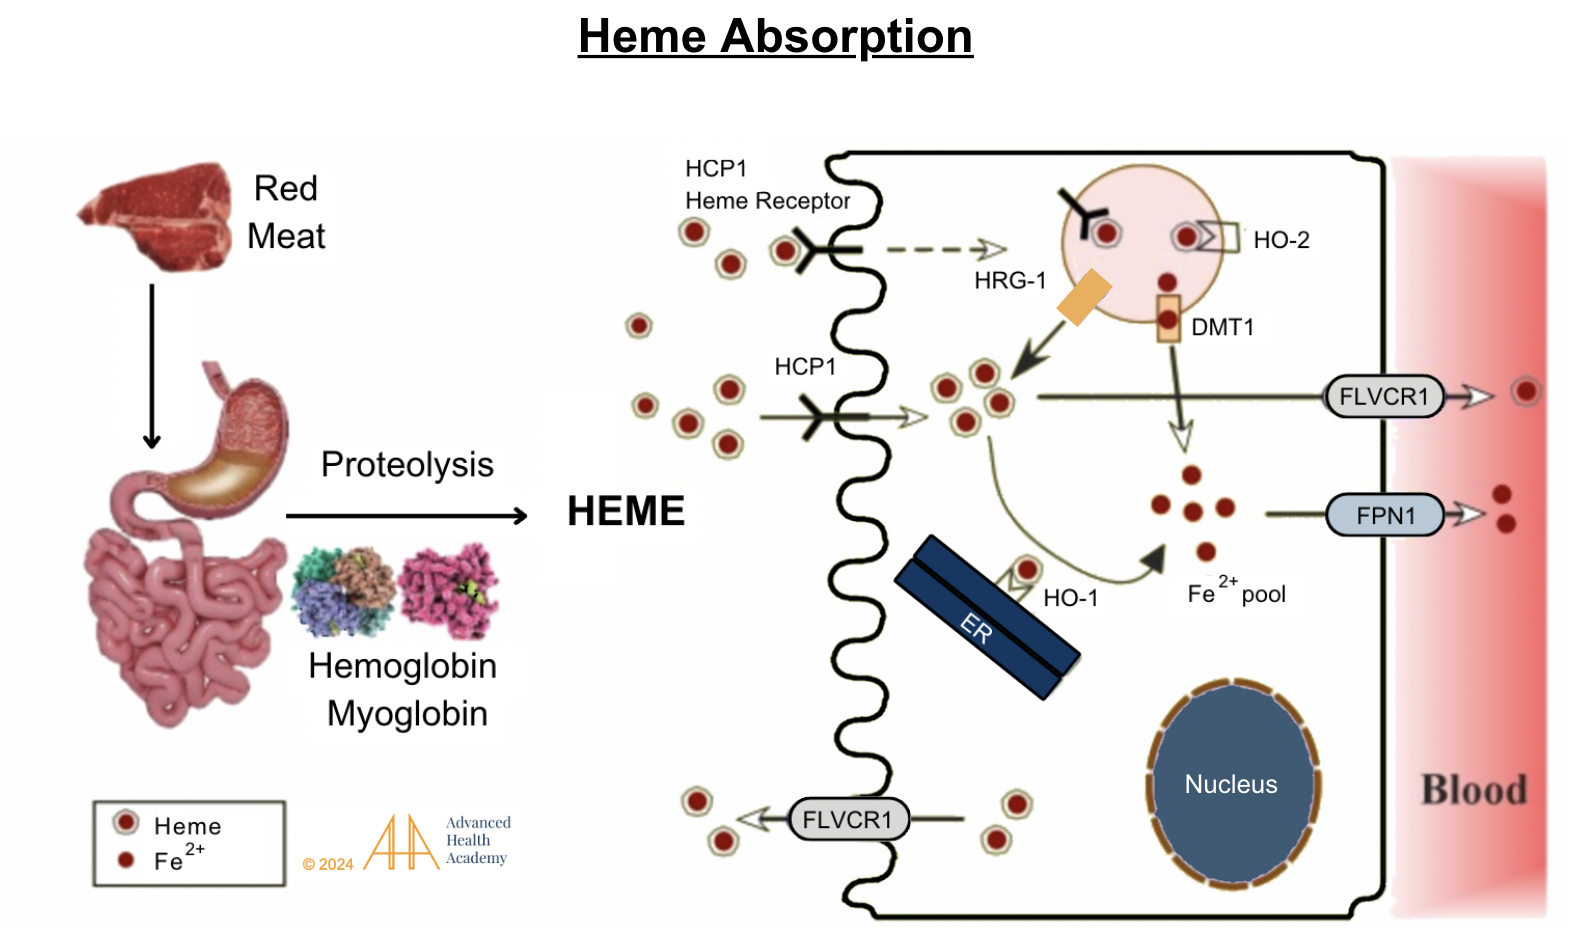
Figure 3: Heme absorption. Stomach acid releases hemoglobin and myoglobin from dietary meat. Protease enzymes in the stomach and small intestine separate heme-iron from globin and release iron (Fe2+). Heme and iron are absorbed in the small intestine by binding to receptors (HCP1 and FLVCR1) . They then attach to transporter proteins and are either released into the blood, excreted, or recycled in the liver.
Formation of Unconjugated and Conjugated Bilirubin
Bilirubin has two forms: conjugated and unconjugated. An enzyme converts biliverdin into unconjugated bilirubin (UCB), a yellow compound that doesn’t dissolve in water2. UCB binds to albumin and travels to the liver, where it is processed into bile, stored in the gallbladder, or excreted in stool or urine. When the gut lacks healthy bacteria (dysbiosis), bilirubin processing can overload the liver, causing it to enter the bloodstream, damage cells, and cross the blood-brain barrier. 15
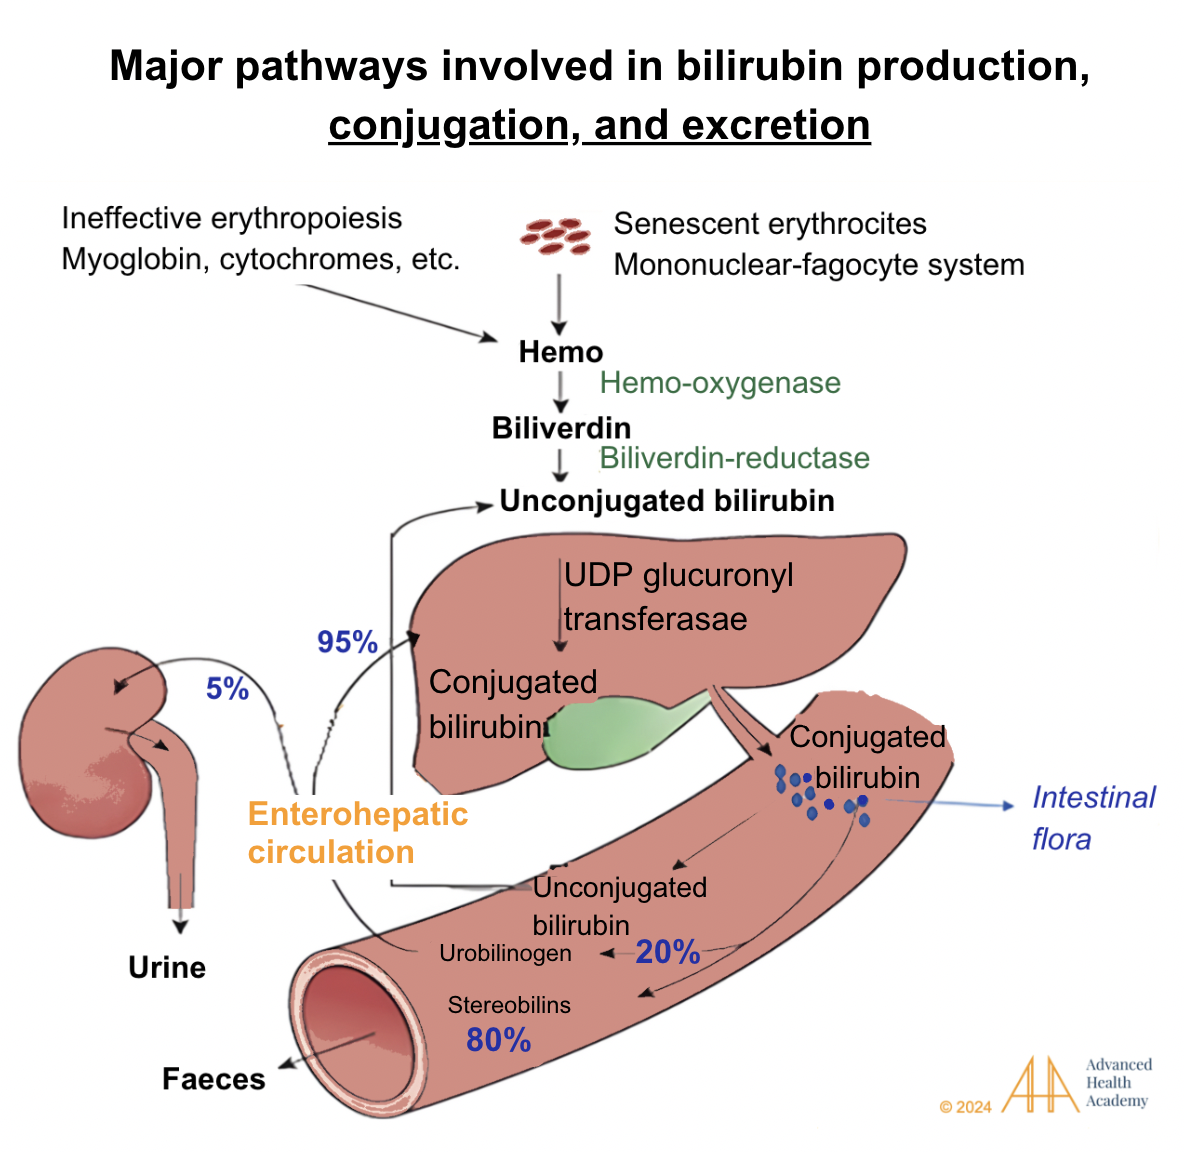
Figure 4: Major pathways involved in bilirubin production, conjugation, and excretion. Bilirubin is transported to the liver, where UGT glucuronyl transferase combines it with glucuronic acid to form conjugated bilirubin. This is stored as bile or excreted into the intestine, where bacteria convert it into urobilinogen. About 80% becomes stercobilin, coloring stool brown, while 20% is reabsorbed. Of the reabsorbed urobilinogen, 95% returns to the liver, and 5% goes to the kidneys, forming urobilin, which colors urine yellow .
Bilirubin’s Roles in the Body
Bilirubin is an antioxidant that reduces harmful reactive oxygen species (ROS), which can disrupt metabolism and damage cells2. When oxygen levels in tissues drop below 2%, bilirubin both free and albumin-bound, neutralizes free radicals like nitric oxide, carbon monoxide, and hydrogen sulfide . Low bilirubin levels are linked to higher ROS, increasing the risk of vascular inflammation, atherosclerosis, and oxidative stress-related health issues. Understanding bilirubin’s role as a hormone is essential for diagnosing and treating metabolic disorders.
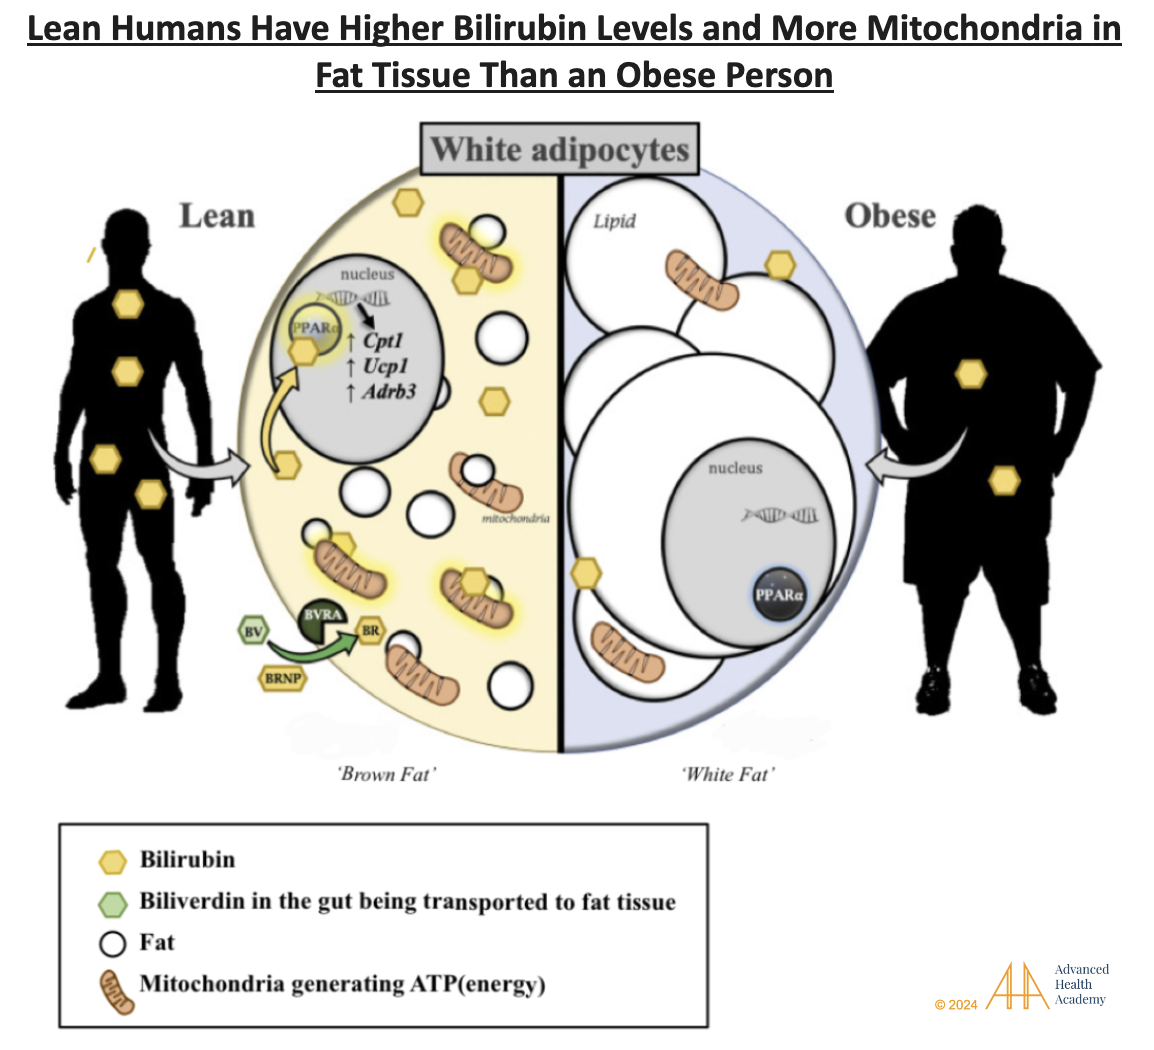
Figure 5: Lean people have higher levels of bilirubin and PPAR-alpha, a key protein that regulates fat metabolism and energy production.. PPAR-alpha is active in the liver, fat, kidneys, heart, and muscles. PPAR-alpha is active in the liver, fat, kidneys, heart, and muscles . These cells struggle to process ketones, an essential energy source.
Figure 5 shows heme being converted to biliverdin (green oval) through a reaction with oxygen (O2), NADPH, and the enzyme heme oxygenase (HO), releasing carbon monoxide. Biliverdin can be converted back to bilirubin (dotted line) by reactive oxygen species (ROS). Bilirubin acts as a master metabolic hormone, regulating fat cell size, number, mitochondrial activity, and body weight reduction.
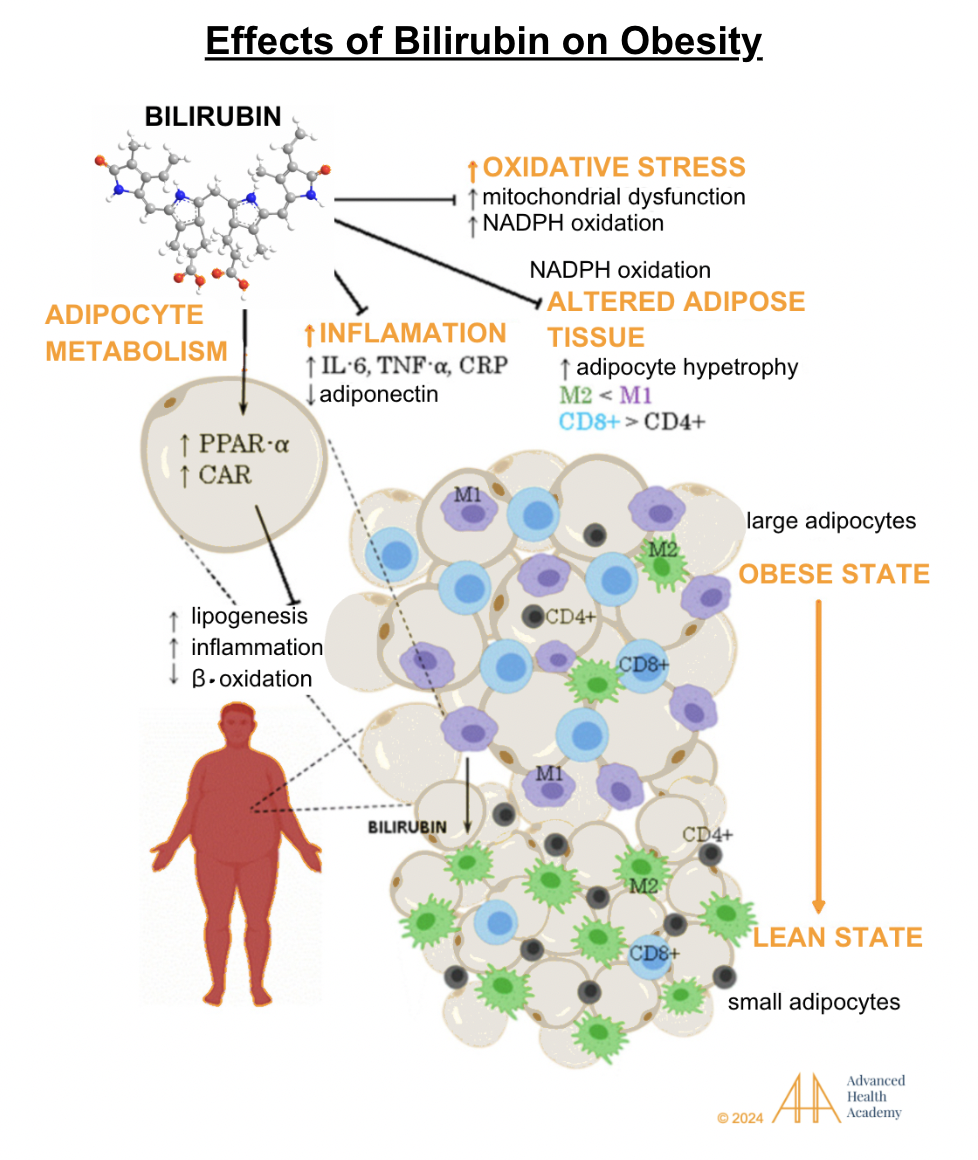
Figure 6: Effects of bilirubin on obesity.
Obesity is linked to lower bilirubin and PPAR-alpha activity, reducing the ability to use ketones for energy. “Whitening” of fat increases reactive oxygen species (ROS), inflammatory proteins like IL-6, TNF-alpha, and CRP, and oxidation of cholesterol and proteins. These deposit on damaged blood vessels, causing inflammation. Obesity accelerates cell damage and recruits white blood cells, platelets, and smooth muscle cells to clear debris, repair tissue, and form new blood vessels.
Clinical Significance of Monitoring Bilirubin Levels
Abnormal bilirubin levels are linked to faster red blood cell (RBC) destruction, disrupting normal body functions and metabolism. Reduced production of transporter proteins to clear RBC byproducts can raise bilirubin levels in the bloodstream.
Elevated Bilirubin Levels
Hyperbilirubinemia means elevated serum or plasma bilirubin levels above the laboratory reference range due to issues with bilirubin metabolism and excretion. Hyperbilirubinemia is further classified as unconjugated (indirect; UCB) or conjugated (direct; CB).
Conjugated hyperbilirubinemia makes up most cases of high bilirubin levels. It is often linked to elevated alkaline phosphatase compared to other liver function markers like alanine and aspartate aminotransferases. Liver biopsies may show bilirubin buildup in liver cells.
Unconjugated hyperbilirubinemia is usually harmless, except in newborns with immature livers that can’t process bilirubin effectively. High UCB levels can cross the blood-brain barrier, causing serious neurological damage.
Infants who don’t get enough breast milk, have poor gut microbiota colonization (due to C-section delivery or antibiotic exposure), or have inherited conditions like Gilbert syndrome, Crigler-Najjar syndrome, or hemolytic anemia may struggle to conjugate and excrete bilirubin, leading to unconjugated hyperbilirubinemia .
Lung disorders (such as sarcoidosis) can decrease oxygen delivery to cells, and carbon monoxide (a toxic byproduct of RBC destruction) and carbon dioxide exhalation (cellular waste), thereby enhancing the development and progression of hemolytic anemia and unconjugated hyperbilirubinemia.
High estrogen and progesterone metabolites, commonly seen in late pregnancy, can increase conjugated bilirubin levels .
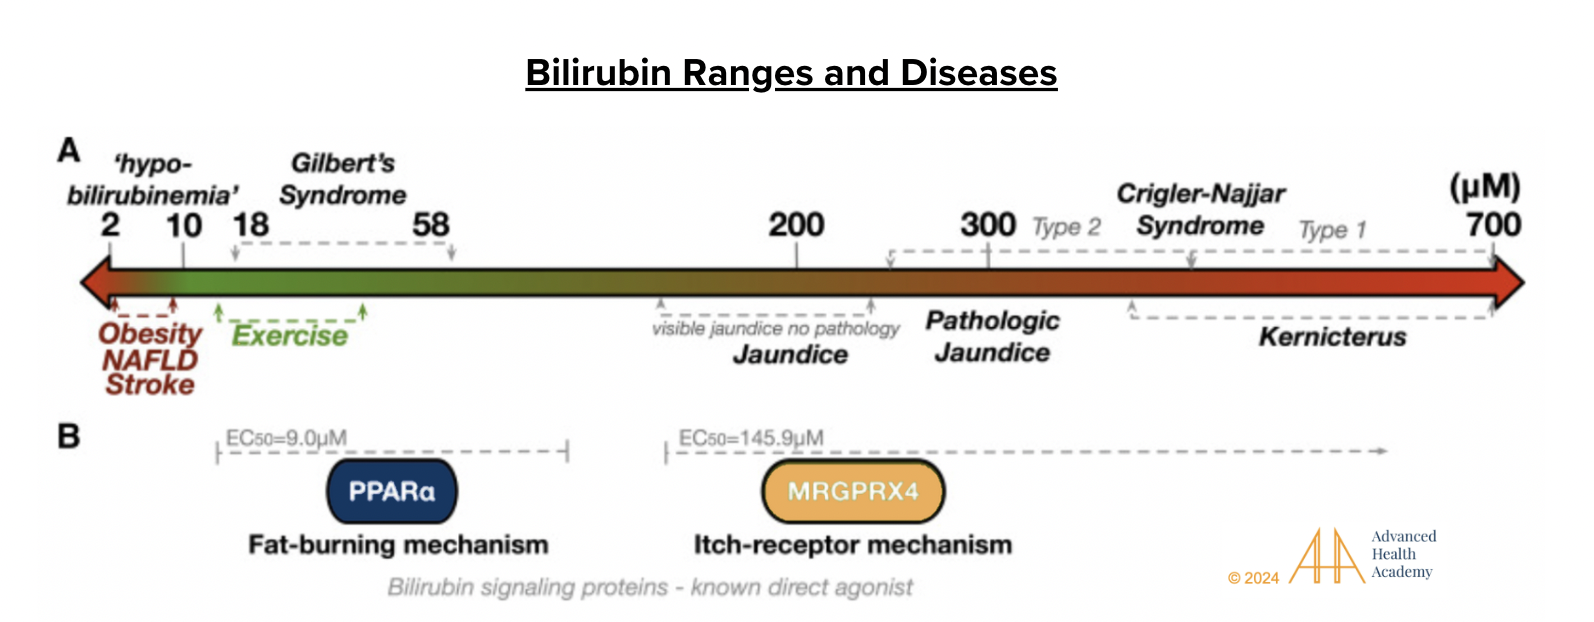
Figure 7: Bilirubin ranges and diseases. The double-headed arrow shows serum bilirubin levels and related effects. Levels of 2–10 µM (“hypobilirubinemia”) are linked to obesity, NAFLD, and stroke. At 14–40 µM, bilirubin acts as a hormone, boosting fat burning, often with exercise. Gilbert’s syndrome is linked to 18–58 µM. At 200 µM, jaundice appears, activating GPCR MRGPRX4 and causing itching. Near 300 µM, as in Crigler-Najjar syndrome, bilirubin becomes a pro-oxidant, damaging cells, crossing the blood-brain barrier, and affecting brain function. Severe hyperbilirubinemia (kernicterus) can harm nerves, impair vision, hearing, speech, cognition, and disrupt hormonal and electrolyte balance .
Depressed Bilirubin Levels
Hypobilirubinemia means depressed serum or plasma bilirubin levels above the laboratory reference range. It is usually not a cause for concern. In some cases, hypobilirubinemia can occur when the concentration and abundance of healthy gut bacteria is decreased (dysbiosis), thereby hindering the digestion of food, absorption of essential nutrients, and the excretion of toxic cellular waste out of the body.
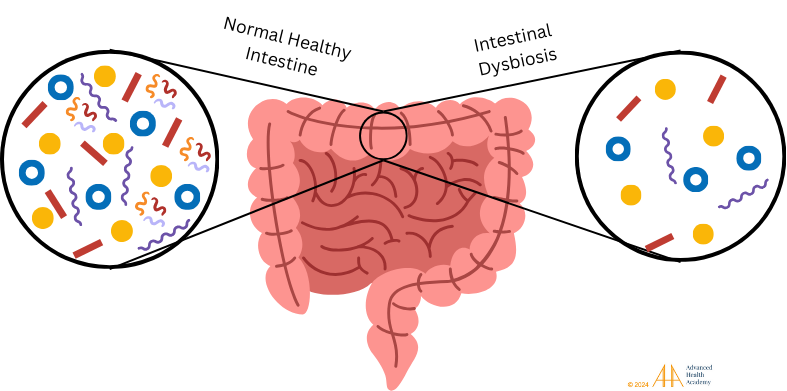
Figure 8: Healthy gut microbiota in the small and large intestines are vital for digestion, nutrient absorption, and waste removal. A balanced microbiota supports metabolic health, while dysbiosis, or an imbalance of healthy bacteria, disrupts metabolism and allows harmful pathogens like viruses, fungi, and harmful bacteria to thrive, affecting immune responses.
Dysbiosis can lead to nutrient deficiencies, reducing hemoglobin and red blood cell (RBC) production while increasing RBC destruction and toxic byproducts in the blood. Chronic hemolysis diverts nutrients, oxygen, and energy from organs, disrupting normal functions, lowering RBC metabolite uptake, and causing reduced blood bilirubin levels (hypobilirubinemia).
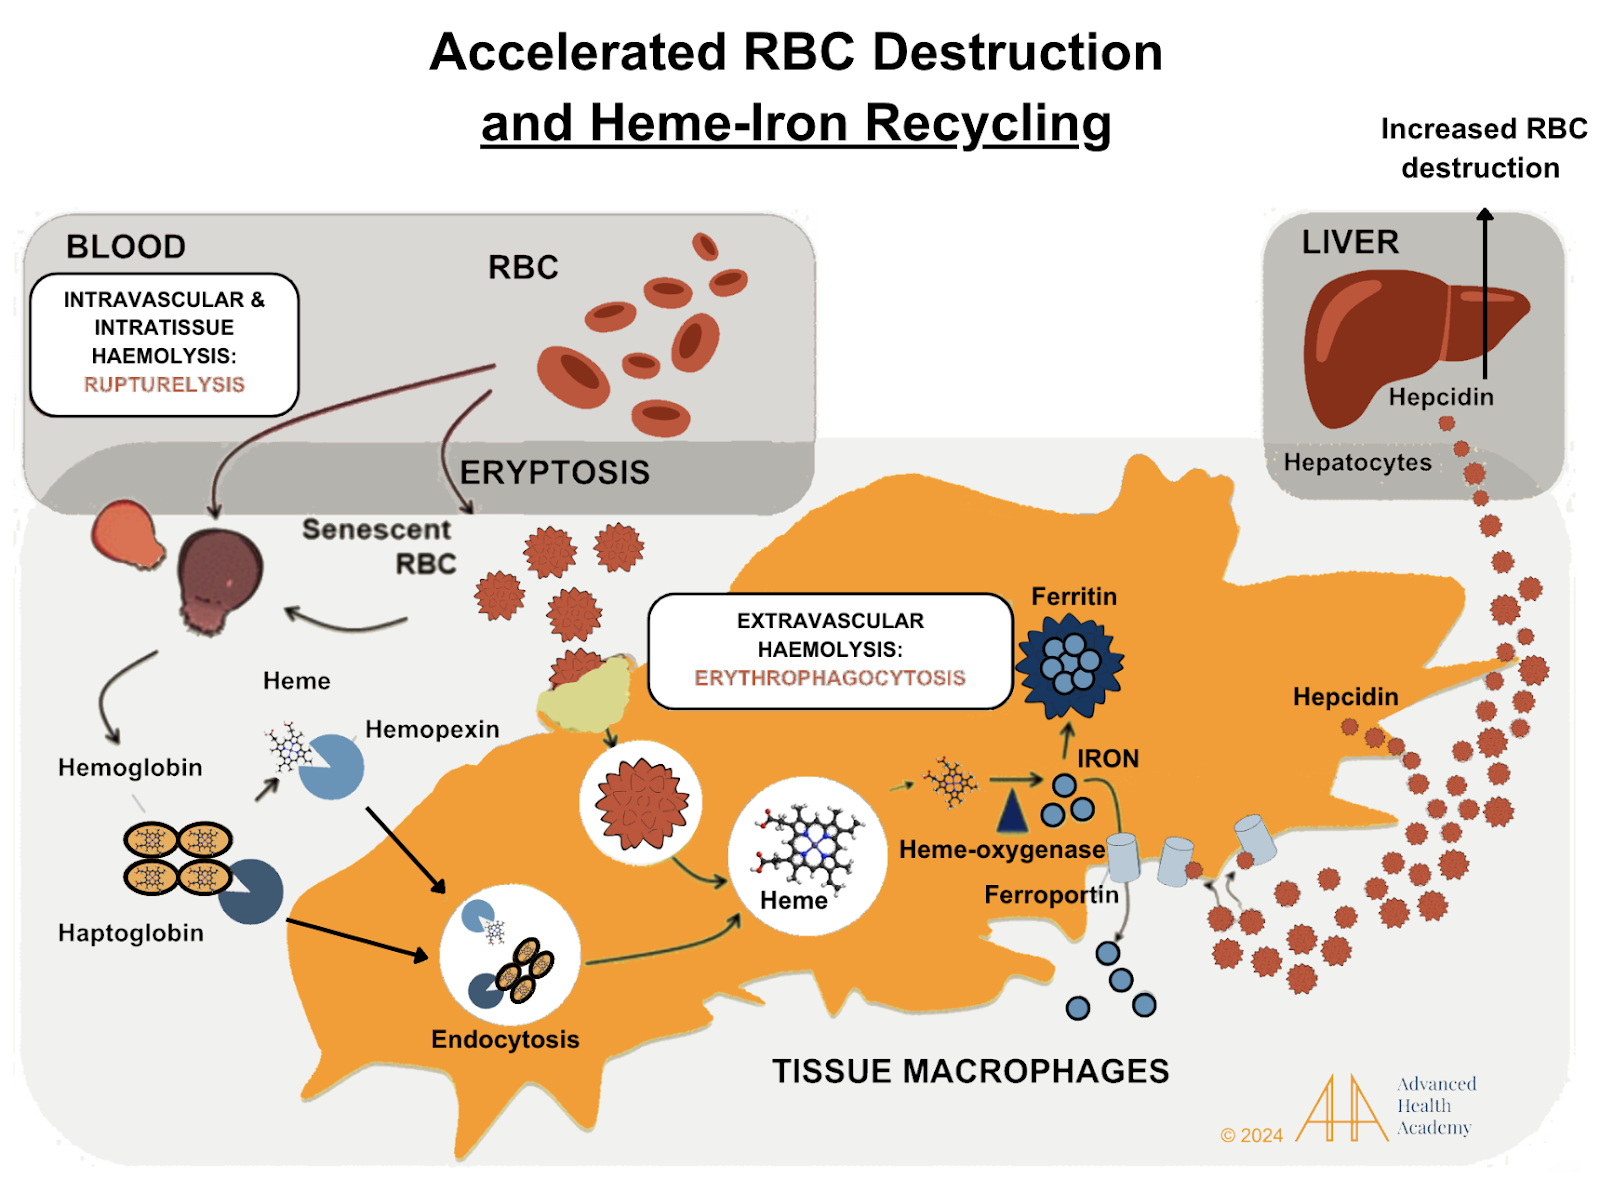
Figure 9: Accelerated red blood cell (RBC) destruction releases toxic byproducts, which proteins like haptoglobin and hemopexin bind and deliver to the liver or spleen. Macrophages break down these complexes, and heme is converted to iron. Iron is stored in ferritin or transported by ferroportin. Hepcidin, a hormone from the liver, blocks ferroportin, reducing iron release and absorption in the gut. High reactive oxygen species (ROS) increase hepcidin and ferritin, storing more iron in tissues (hemochromatosis) and lowering oxygen delivery .
Accelerated hemolysis recruits macrophages, platelets, and smooth muscle cells to repair damage and ingest oxidized cholesterol, creating excess ROS. This damages cells, disrupts metabolism, and causes iron buildup in the liver, pancreas, and muscles, reducing energy. Pancreatic iron overload (hemochromatosis) lowers insulin and glucagon, reducing glucose uptake, increasing fat storage, and decreasing fat breakdown. Low mitochondrial function and bilirubin levels, along with oxidized cholesterol and proteins, drive inflammation .
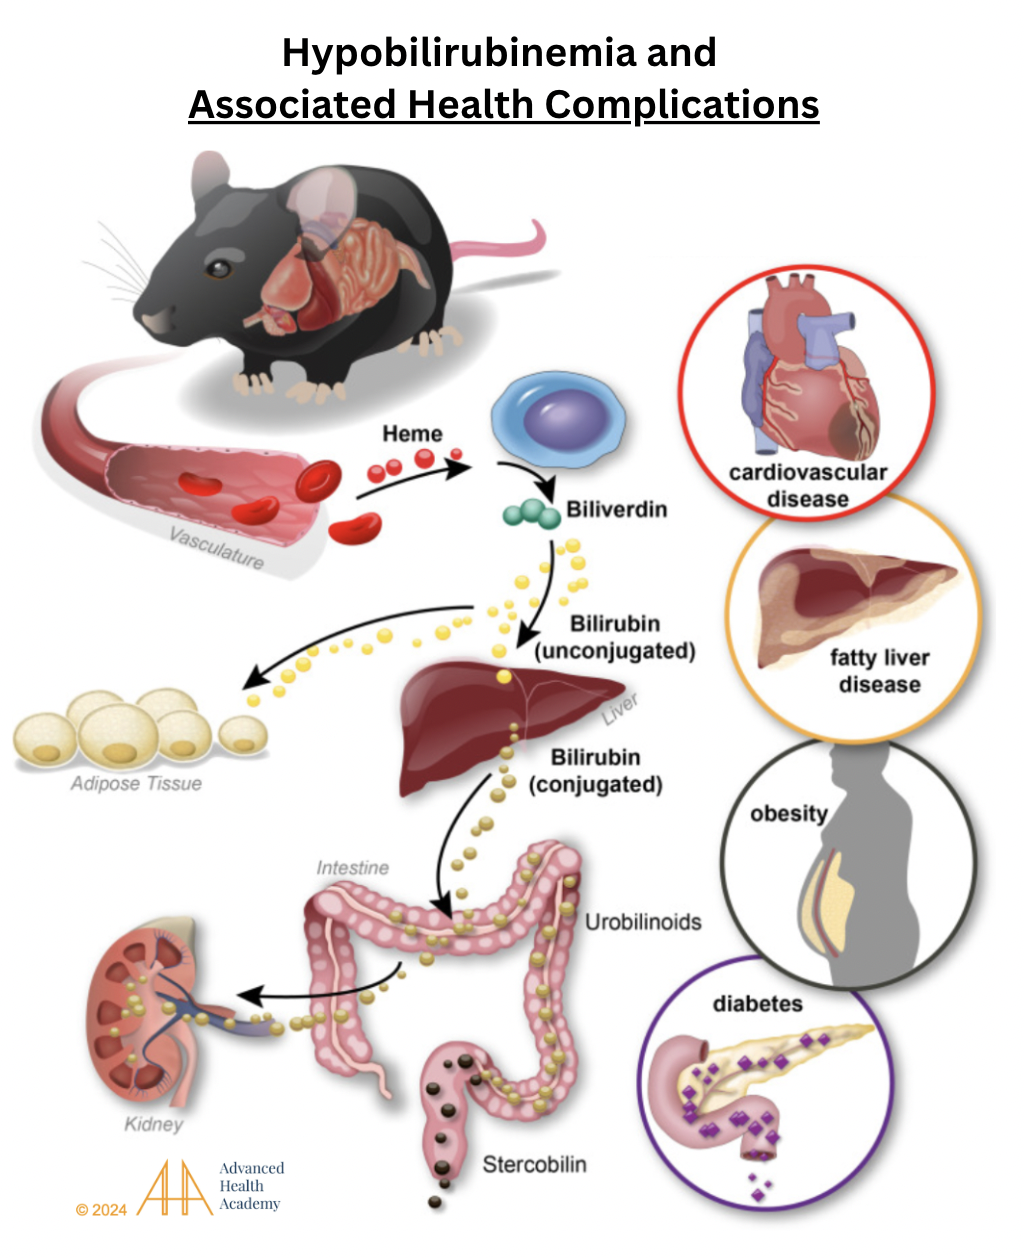
Figure 10: Hypobilirubinemia and associated health complications. Damaged red blood cells (RBCs) release heme, which is converted to biliverdin (green) and then to unconjugated bilirubin (UB; yellow). UB travels to fat cells or the liver, where it is conjugated (brownish-yellow) and processed into urobilinogen and stercobilin in the intestines, then excreted in stool and urine. In fat cells, bilirubin boosts mitochondria and energy production. Chronic hemolysis lowers bilirubin, reduces metabolism, and raises ROS, cholesterol, and protein oxidation, leading to cardiovascular disease, fatty liver, obesity, and diabetes .
Hyperbilirubinemia is linked to excess bile salt storage (gallstones), which can damage the bile duct (cholestasis) and gallbladder (cholecystitis). Blocked bile flow disrupts fat metabolism and energy production (ketogenesis),,, causing symptoms like jaundice (yellow skin, eyes, and tongue), pale stool, dark urine, and abdominal fluid buildup.
Excess oxidized cholesterol can embed in injured arteries, attracting macrophages, platelets, and smooth muscle cells to form clots, deposit plaque, and clear debris. This process, called atherosclerosis, restricts blood flow, increases blood pressure, redirects venous flow, and causes blood to back up, enlarging and impairing organs like the heart and spleen.

Figure 11: Atherosclerosis causes artery thickening (tunica intima hyperplasia) and clot formation by platelets. Macrophages ingest oxidized LDL cholesterol, becoming foam cells that release inflammatory proteins and ROS. Chronic inflammation increases white blood cells and platelets, damaging cells and microbiota, reducing organ function, and raising the risk of health issues.
Atherosclerosis-induced inflammation increases white blood cells and platelets at injury sites, protecting pathogens (e.g., HIV, hepatitis, tetanus, coronavirus) and tumor cells. These pathogens and cancer cells use free heme-iron and cholesterol to prevent bleeding, promote tumor growth, metastasis, and worsen infections .
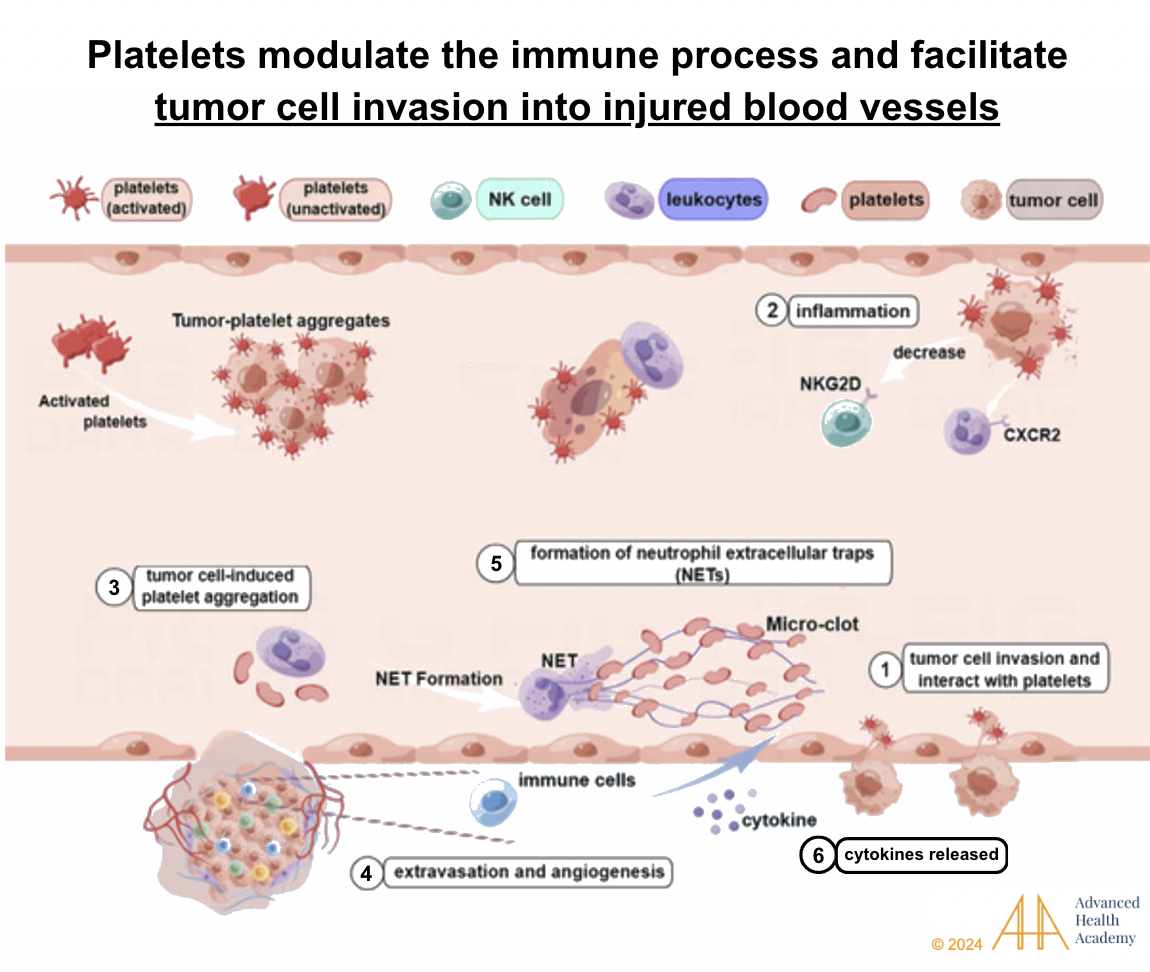
Figure 12: Platelets regulate immunity and aid tumor cells in invading injured blood vessels. Reactive oxygen species and cytokines enhance interactions between tumor cells, white blood cells, and platelets. Tumor cells trigger platelet clumping and support new blood vessel growth (angiogenesis). Natural killer (NK) cells are blocked from destroying tumor cells and pathogens, while neutrophils focus on stabilizing blood vessels and protecting tumor cells. This process promotes tumor growth, spread, and invasion, leading to poorer survival rates.
Prevalence and Statistics of Abnormal Bilirubin Levels
Bilirubin-related conditions are extremely common and associated with hemolytic anemia. Its prevalence depends on the root cause.
Conjugated hyperbilirubinemia is common in liver and bile duct dysfunction or systemic infections. Inherited diseases linked to it affect 4–13% of the U.S. population. Dubin-Johnson syndrome (DJS) is rare, except in Iranian Jews, where it occurs in about 1 in 1,300 people.
Unconjugated hyperbilirubinemia is common in newborns, affecting 50% of full-term and 80% of preterm infants within 2–4 days after birth when bilirubin levels reach 5 mg/dL or higher. It results from higher red blood cell turnover (lifespan ~85 days) and low UGT1A1 enzyme activity. Up to 6.1% of newborns may have bilirubin levels above 12.9 mg/dL. Genetic causes include Crigler-Najjar syndrome (CNS) and Gilbert syndrome.
CNS) is a rare autosomal recessive disorder, with fewer than 50 cases in the U.S. and about 1 per million births globally71 . Mutations in the UGT1A1 gene can cause complete (CNS type I) or partial (CNS type II) loss of bilirubin processing. Without treatment, stress or illness can trigger unconjugated hyperbilirubinemia-induced encephalopathy, leading to severe neurological damage or death in infants.,,.
Gilbert syndrome (GS), the most common hereditary hyperbilirubinemia, affects 3–13% of people . It results from a ~50% decrease in bilirubin UGT enzyme activity and is an autosomal recessive disorder, with patients being homozygous or compound heterozygous . Over 100 mutations are linked to GS, varying by ethnicity. In Caucasians, the most common mutation is UGT1A1*28, involving two extra base pairs in the UGT1A1 gene promoter . In East Asians, GS is often caused by the G71R mutation in exon 1. GS is more common in males and affects 5–15% of the U.S. population Moreover, GS is more common in males than females, possibly due to the varying rates of bilirubin production in the different sexes.
Defects in RBC membrane genes, like hereditary spherocytosis and G6PD deficiency, can cause unconjugated hyperbilirubinemia. In the U.S. kernicterus registry, 56% of cases involved factors increasing bilirubin levels: 21.3% had G6PD deficiency, 20.5% had severe hemolysis, 15% had birth trauma, and 7% had other causes (e.g., galactosemia, Crigler-Najjar syndrome, or sepsis). No cause was found in 43.4% of cases..
Defects in hemoglobin genes, like sickle cell anemia (SCA) and thalassemia, can cause unconjugated hyperbilirubinemia. In SCA, increased RBC destruction (hemolysis) and UGT1A1 promoter variations raise bilirubin levels, increasing the risk of gallbladder dysfunction (cholelithiasis). Studies show higher bilirubin levels and cholelithiasis frequency in patients with Gilbert syndrome (UGT1A1 polymorphism), confirming its role in SCA-related hyperbilirubinemia.
The incidence of kernicterus is slightly higher in high-resource countries (1.3 per 100,000 births). Rates are 0.5–1 per 100,000 births in Canada, the U.S., and Denmark, and below 0.5 per 100,000 in Norway ,, . Severe neonatal hyperbilirubinemia (≥30 mg/dL) occurs in 7–45 per 100,000 births in Europe and the U.S ,,,.
Conclusion
Bilirubin, a waste product from red blood cells (RBCs), protects against oxidative damage but can harm cells and organs if it builds up. Transporter proteins safely move bilirubin in the blood to prevent tissue deposits. It is stored as bile in the gallbladder or excreted through stool or urine.
There are two types of bilirubin: conjugated and unconjugated. High unconjugated bilirubin levels are common in newborns due to immature livers. Elevated bilirubin, often caused by increased RBC destruction, can disrupt waste clearance. Tracking bilirubin levels helps assess RBC and liver health, waste excretion, and identify underlying conditions in all ages.
Source References and Supplemental Research:
Kumar V, Abbas AK, Aster JC. Robbins Basic Pathology. 9th ed. Philadelphia, PA: Elsevier Saunders; 2013.
Maines MD. Heme oxygenase: function, multiplicity, regulatory mechanisms, and clinical applications. FASEB J. 1988;2(10):2557-68.
Gupta C. P. Role of Iron (Fe) in Body. IOSR J. Appl. Chem. (IOSR-JAC 2014, 7 (11), 38–46. 10.9790/5736-071123846.
McDonagh AF. The biliverdin-bilirubin antioxidant cycle of cellular protection: Missing a wheel? Free Radic Biol Med. 2010;49(5):814-820.
Strassburg CP. Pharmacogenetics of Gilbert’s syndrome. Pharmacogenomics. 2008;9(6):703-715.
Heirwegh KPM, Brown SB. The chemical nature of bilirubin. In: Ostrow JD, ed. Bile Pigments and Jaundice. New York, NY: Marcel Dekker; 1986:17-80.
Jacobsen J, Wennberg RP. Determination of unbound bilirubin in the serum of newborns. Clin Chem. 1974;20(7):783-9.
Watkins JB. Bile pigment metabolism in newborn infants. J Pediatr. 1976;88(5 Pt 2):845-51.
Schmid R. Metabolism and disposition of bilirubin. Semin Liver Dis. 1988;8(2):116-27.
Fevery J. Bilirubin in clinical practice: a review. Liver Int. 2008;28(5):592-605.
Wong RJ, Vreman HJ, Stevenson DK. Neonatal jaundice and liver disease. In: Martin RJ, Fanaroff AA, Walsh MC, eds. Fanaroff and Martin’s Neonatal-Perinatal Medicine. 9th ed. St. Louis, MO: Mosby Elsevier; 2011:1443-77.
Stocker R, Yamamoto Y, McDonagh AF, Glazer AN, Ames BN. Bilirubin is an antioxidant of possible physiological importance. Science. 1987;235(4792):1043-6. [DOI]
Baranano DE, Rao M, Ferris CD, Snyder SH. Biliverdin reductase: a major physiologic cytoprotectant. Proc Natl Acad Sci USA. 2002;99(25):16093-8.
Maisels MJ, McDonagh AF. Phototherapy for neonatal jaundice. N Engl J Med. 2008;358(9):920-8.
American Academy of Pediatrics Subcommittee on Hyperbilirubinemia. Management of hyperbilirubinemia in the newborn infant 35 or more weeks of gestation. Pediatrics. 2004;114(1):297-316.
Gartner LM, Arias IM, Furman M, Petersson RS. On the nature of the diazo-positive substances in serum and bile of newborn infants with physiological jaundice. Pediatrics. 1962;29:527–35.
Gartner LM, Lee KS, Moscioni AD. Effect of milk feeding on intestinal bilirubin absorption in the rat. J Pediatr. 1977;91(6):959-61.
Lee WM. Drug-induced hepatotoxicity. N Engl J Med. 2003;349(5):474-85.
Chalasani N, Fontana RJ, Bonkovsky HL, Watkins PB, Davern T, Serrano J, Yang H, Rochon J; Drug Induced Liver Injury Network (DILIN). Causes, clinical features, and outcomes from a prospective study of drug-induced liver injury in the United States. Gastroenterology. 2008;135(6):1924-34.
Heirwegh KPM, Brown SB. The chemical nature of bilirubin. In: Ostrow JD, ed. Bile Pigments and Jaundice. New York, NY: Marcel Dekker; 1986:17-80.
Watkins JB. Bile pigment metabolism in newborn infants. J Pediatr. 1976;88(5 Pt 2):845-51.
Bhutani VK, Johnson L, Sivieri EM. Predictive ability of a predischarge hour-specific serum bilirubin for subsequent significant hyperbilirubinemia in healthy term and near-term newborns. Pediatrics. 1999;103(1):6-14.
Van Imhoff DE, Dijk PH, Hulzebos CV. Hypoalbuminemia and bilirubin-related morbidity and death in preterm infants. Semin Perinatol. 2016;40(7):482-490.
Ramsay DJ. Homeostatic control of water balance. In: Arnaud MJ, editor. Hydration Throughout Life. Montrouge: John Libbey Eurotext; 1998. pp. 9–18.
Bunn HF. Hemoglobin I. Structure and function. In: Beck WS, Hematology. Cambridge, MA: MIT Press, 1981;129.
Wallerstein RO. Laboratory evaluation of anemia. West J Med. 1987;146:443.
Billett H. Chapter 151: Hemoglobin and Hematocrit. Clinical Methods: The History, Physical and Laboratory Examinations. 3rd Edition. Boston: Butterworths; 1990.
McCranor BJ, Kim MJ, Cruz NM, et al. Interleukin-6 directly impairs the erythroid development of human TF-1 erythroleukemic cells. Blood Cells Mol Dis. 2014;52Raj DS. Role of interleukin-6 in the anemia of chronic disease. Semin Arthritis Rheum. 2009;38:382–388.
De Lurdes Agostinho Cabrita A, Pinho A, Malho A, et al. Risk factors for high erythropoiesis-stimulating agent resistance index in pre-dialysis chronic kidney disease patients, stages 4 and 5. Int Urol Nephrol. 2011;43:835–840.
Nazemian F, Karimi G, Moatamedi M, et al. Effect of silymarin administration on TNF-alpha serum concentration in peritoneal dialysis patients. Phytother Res. 2010;24:1654–1657.
Ravasi G, Pelucchi S, Greni F, et al. Circulating factors are involved in hypoxia-induced hepcidin suppression. Blood Cells Mol Dis. 2014;53:204–210.
Nemeth E, Valore EV, Territo M, et al. Hepcidin, a putative mediator of anemia of inflammation, is a type II acute-phase protein. Blood. 2003;101:2461–2463.
Raj DS. Role of interleukin-6 in the anemia of chronic disease. Semin Arthritis Rheum. 2009;38:382–388.
McCranor BJ, Kim MJ, Cruz NM, et al. Interleukin-6 directly impairs the erythroid development of human TF-1 erythroleukemic cells. Blood Cells Mol Dis. 2014;52:126–133.
Gifford GE, Duckworth DH. Introduction to TNF and related lymphokines. Biotherapy. 1991;3:103–111
Chung J, Chen C, Paw BH. Heme metabolism and erythropoiesis. Curr Opin Hematol. 2012 May;19(3):156-62.
Gallagher PG. Abnormalities of the erythrocyte membrane. In: Orkin SH, Fisher DE, Ginsburg D, Look AT, Lux SE, Nathan DG, eds. Nathan and Oski’s Hematology and Oncology of Infancy and Childhood. 8th ed. Philadelphia, PA: Saunders Elsevier; 2015:547.
Cappellini MD, Fiorelli G. Glucose-6-phosphate dehydrogenase deficiency. Lancet. 2008;371(9606):64-74.
Gehrs BC, Friedberg RC. Autoimmune hemolytic anemia. Am J Hematol. 2002;69(4):258-271.
Hom J, Dulmovits B M, Mohandas N, Blanc L. The erythroblastic island as an emerging paradigm in the anemia of inflammation. Immunol Res. 2015 Dec; 63(0): 75–89.
Singh A, Koritala T, Jialal I. Unconjugated hyperbilirubinemia. Stat Pearls. February 20, 2023.
Rother RP, Bell L, Hillmen P, Gladwin MT. The clinical sequelae of intravascular hemolysis and extracellular plasma hemoglobin: a novel mechanism of human disease. JAMA. 2005;293(13):1653-1662.
Kinoshita M, Uchida T, Sato A, Nakashima M, Nakashima H, Shono S, Habu Y, Miyazaki H, Hiroi S, Seki S. Characterization of two F4/80-positive Kupffer cell subsets by their function and phenotype in mice. J Hepatol. 2010;53(5):903-910.
Weiss G. Iron metabolism in the anemia of chronic disease. Biochim Biophys Acta. 2009;1790:682–693.
Weiss G, Goodnough LT. Anemia of chronic disease. N Engl J Med. 2005;352:1011–1023.
Zupanic K, Sucic M, Bekic D. Anemia of chronic disease: illness or adaptive mechanism. Acta Clin Croat. 2014;53:348–354.
Auclair C, Hakim J, Boivin P, Troube H, Boucherot J. Bilirubin and paranitrophenol glucuronyl transferase activities of the liver in patients with Gilbert’s syndrome An attempt at a biochemical breakdown of the Gilbert’s syndrome. Enzyme. 1976;21(2):97-107.
Stevenson DK, Vreman HJ, Wong RJ. Bilirubin production and the risk of bilirubin neurotoxicity. Semin Perinatol. 2011 Jun;35(3):121-6.
Sticova E, Jirsa M. New insights in bilirubin metabolism and their clinical implications. World J Gastroenterol. 2013 Oct 14;19(38):6398-407.
Erps LT, Ritter JK, Hersh JH, Blossom D, Martin NC, Owens IS. Identification of two single base substitutions in the UGT1 gene locus which abolish bilirubin uridine diphosphate glucuronosyltransferase activity in vitro. J Clin Invest. 1994 Feb;93(2):564-70.
Dennery PA, Seidman DS, Stevenson DK. Neonatal hyperbilirubinemia. N Engl J Med. 2001 Feb 22;344(8):581-90.
Owens D, S. Sherlock S. Diagnosis of Gilbert’s Syndrome: Role of Reduced Caloric Intake Test. British Medical Journal, 1973, 3, 559-563.
Zhang D, Chando TJ, Everett DW, Patten CJ, Dehal SS, Humphreys WG. In vitro inhibition of UDP glucuronosyltransferases by atazanavir and other HIV protease inhibitors and the relationship of this property to in vivo bilirubin glucuronidation. Drug Metab Dispos. 2005 Nov;33(11):1729-39.
Chowdhury JR, Wolkoff AW, Chowdhury NR, Arias IM. Hereditary jaundice and disorders of bilirubin metabolism. In: Scriver CR, Beaudet AL, Sly WS, Valle D, eds. The Metabolic and Molecular Bases of Inherited Disease. 8th ed. New York, NY: McGraw-Hill; 2001.
Larrey D, Pageaux GP. Drug-induced acute liver failure. Eur J Gastroenterol Hepatol 2005;17:141–3.
Fontana RJ, Hayashi PH, Gu J, et al.. Idiosyncratic drug-induced liver injury is associated with substantial morbidity and mortality within 6 months from onset. Gastroenterology 2014;147:96–108.e4.
Watkins PB, Kaplowitz N, Slattery JT, et al.. Aminotransferase elevations in healthy adults receiving 4 grams of acetaminophen daily: a randomized controlled trial. JAMA 2006;296:87–93.
McGill MR, Jaeschke H. Metabolism and disposition of acetaminophen: recent advances in relation to hepatotoxicity and diagnosis. Pharm Res 2013;30:2174–87.
McGill MR, Sharpe MR, Williams CD, et al.. The mechanism underlying acetaminophen-induced hepatotoxicity in humans and mice involves mitochondrial damage and nuclear DNA fragmentation. J Clin Invest 2012;122:1574–83.
Reuben A, Koch DG, Lee WM, Acute Liver Failure Study Group. Drug-induced acute liver failure: results of a U.S. multicenter, prospective study. Hepatology 2010;52:2065–76.
Yuan L, Kaplowitz N. Mechanisms of drug-induced liver injury. Clin Liver Dis 2013;17:507–18, vii 10.1016/j.cld.2013.07.002
Kaplowitz N. Idiosyncratic drug hepatotoxicity. Nat Rev Drug Discov 2005;4:489–99.
Russmann S, Jetter A, Kullak-Ublick GA. Pharmacogenetics of drug-induced liver injury. Hepatology 2010;52:748–61.
Devarbhavi H, Raj S, Aradya VH, et al.. Drug-induced liver injury associated with Stevens-Johnson syndrome/toxic epidermal necrolysis: patient characteristics, causes, and outcome in 36 cases. Hepatology 2016;63:993–9. 10.1002/hep.28270
Andrade RJ, Lucena MI, Fernández MC, et al.. Drug-induced liver injury: an analysis of 461 incidences submitted to the Spanish registry over a 10-year period. Gastroenterology 2005;129:512–21. 10.1016/j.gastro.2005.05.006
Chalasani N, Bonkovsky HL, Fontana R, et al.. Features and Outcomes of 899 Patients With Drug-Induced Liver Injury: The DILIN Prospective Study. Gastroenterology 2015;148:1340–52.e7. 10.1053/j.gastro.2015.03.006
Russmann S, Jetter A, Kullak-Ublick GA. Pharmacogenetics of drug-induced liver injury. Hepatology 2010;52:748–61.
Devarbhavi H, Raj S, Aradya VH, et al.. Drug-induced liver injury associated with Stevens-Johnson syndrome/toxic epidermal necrolysis: patient characteristics, causes, and outcome in 36 cases. Hepatology 2016;63:993–9. 10.1002/hep.28270
Calabrese V, Mancuso C, Calvani M, Rizzarelli E, Butterfield DA, Stella AM. Nitric oxide in the central nervous system: neuroprotection versus neurotoxicity. Nat Rev Neurosci. 2007;8(10):766–775. [PubMed] [Google Scholar]
10. Mancuso C, Navarra P, Preziosi P. Roles of nitric oxide, carbon monoxide, and hydrogen sulfide in the regulation of the hypothalamic-pituitary-adrenal axis. J Neurochem. 2010;113(3):563–575. [PubMed] [Google Scholar]
11. Rochette L, Cottin Y, Zeller M, Vergely C. Carbon monoxide: mechanisms of action and potential clinical implications. Pharmacol Ther. 2013;137(2):133–152. [PubMed] [Google Scholar]