HbA1c: Diagnostic Significance and Clinical Insights
Authors: Dr. Payal Bhandari, M.D., Hailey Chin
Contributors: Vivi Chador, Amer Džanković, Tejal
Key Insights
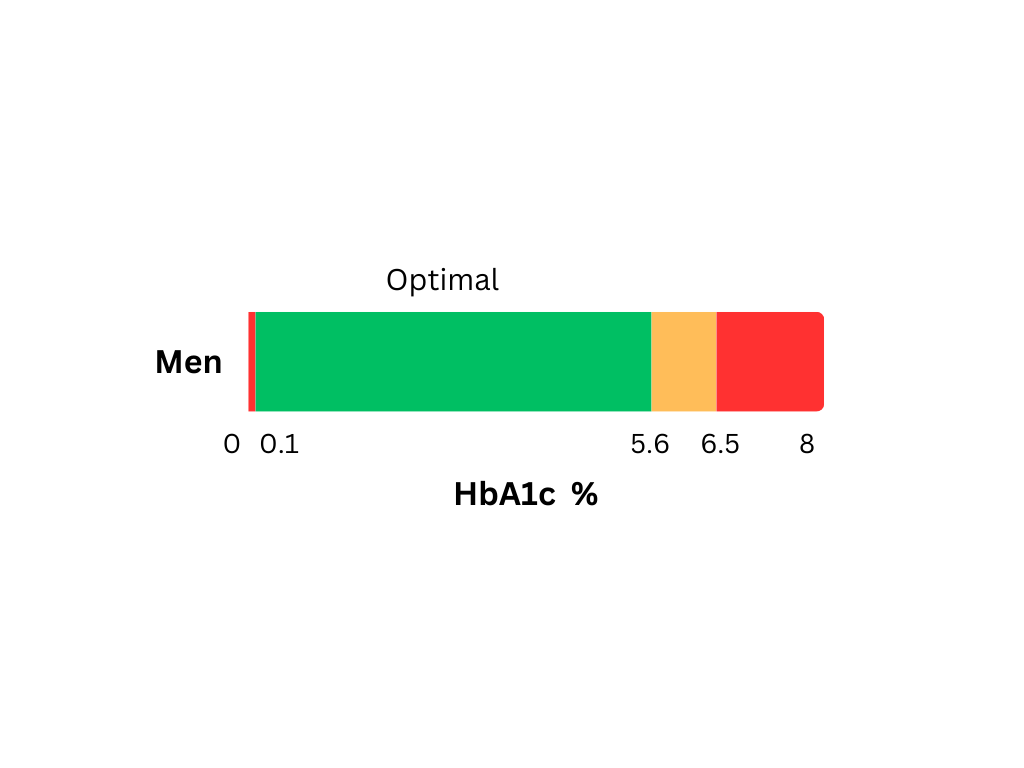
HbA1c testing tracks long-term blood sugar control by showing average glucose levels over the past 8-12 weeks. It helps screen for diabetes risk, guide treatment, and monitor progress. Figure 1 shows common symptoms of abnormal HbA1c. Lowering HbA1c is key to preventing health problems from high blood sugar.
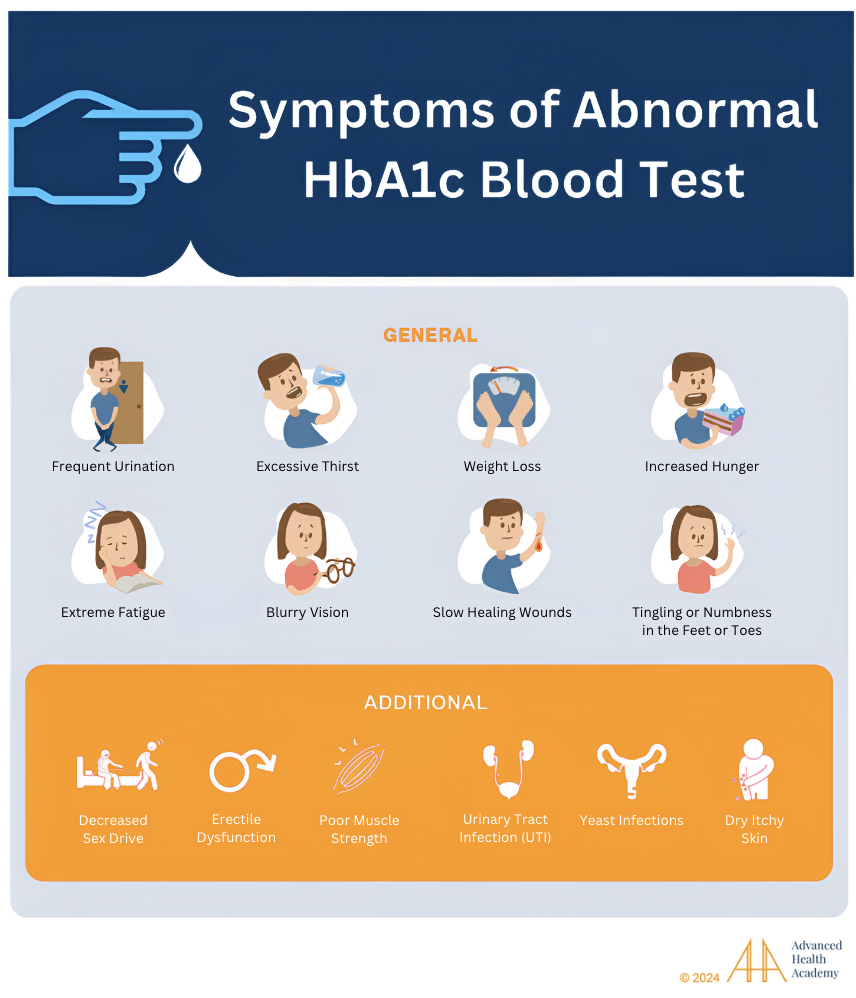
Figure 1: Symptoms and Signs Associated with an Abnormal HbA1c Blood Test
What Is HbA1c?
The HbA1c test measures the average blood sugar (glucose) attached to hemoglobin (Hb) over the past 90 days. It helps check insulin resistance and manage diabetes. Unlike a blood glucose test, it doesn’t require fasting and isn’t affected by short-term changes from meals, stress, or illness .
Hemoglobin in red blood cells carries oxygen. HbA1c forms when glucose attaches to hemoglobin. This happens over the life of a red blood cell, about 120 days, reflecting average blood sugar during that time.
Physiology of Hemoglobin
Origin and Formation of the Hemoglobin
Hemoglobin (Hb) is a protein in red blood cells (RBCs) that carries oxygen and gives blood its red color. It makes up 96-97% of the dry weight of RBCs, with each cell containing 640 million Hb molecules. Hb A is the most common type.

Figure 2: Hemoglobin structure.
Each Hb molecule has four parts, made of two alpha and two beta-globin chains, and heme groups with iron at the center. Vitamin B12 and folate help oxygen bind to the iron atoms, allowing Hb to carry up to four oxygen molecules. 15 percent of hemoglobin (Hb) is formed in the mitochondria of the liver, while 85 percent occurs in the bone marrow .
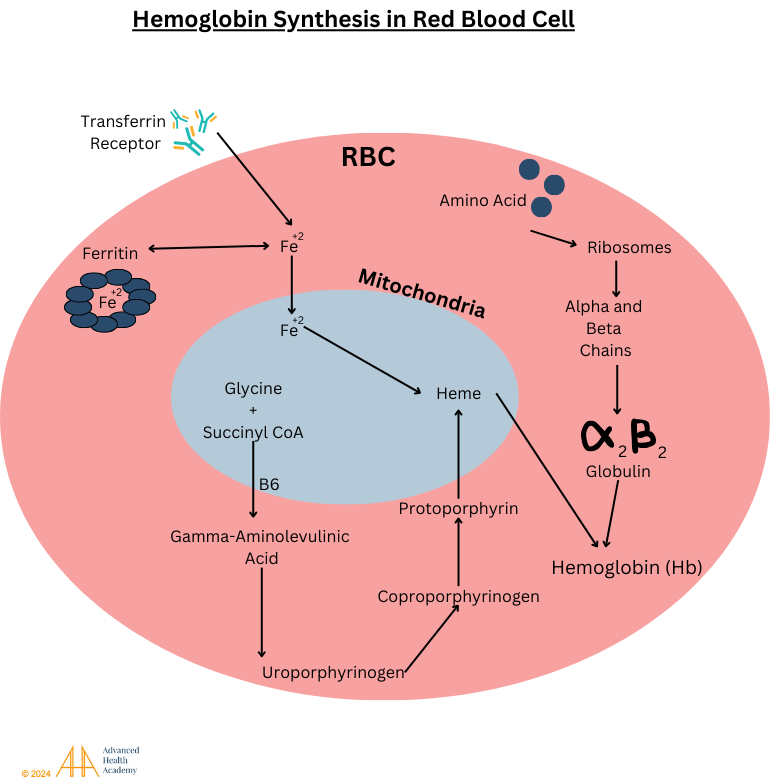
Figure 3: Hemoglobin is made inside a red blood cell. The cell’s cytoplasm makes the globin chains (alpha and beta), while the mitochondria create heme. The heme is then brought to the cytoplasm, where it joins the globin chains to form hemoglobin.
Role of Hemoglobin
The main job of red blood cells (RBCs) is to carry oxygen (O2) from the lungs to tissues and remove carbon dioxide (CO2). Think of RBCs like a car, and hemoglobin (Hb) as the driver, picking up oxygen in the lungs and delivering it throughout the body.
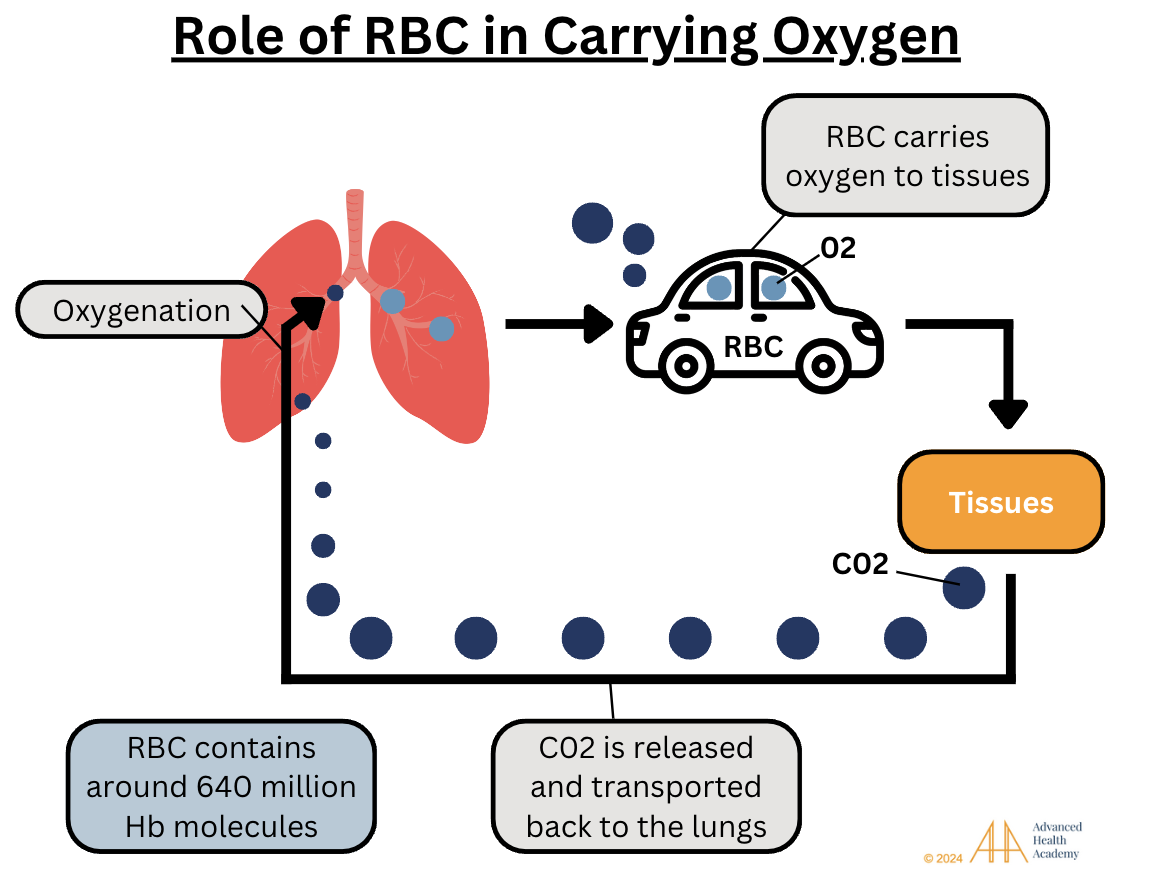
Figure 4: Red blood cells’ (RBCs) main job is to carry oxygen (O2) to tissue and release the waste product, carbon dioxide (CO2) during exhalation. RBCs contain around 640 million hemoglobin molecules per cell.
98 to 99 percent of O2 is carried by hemoglobin in RBCs. Since oxygen doesn’t dissolve well in blood, less than 2% is carried in the plasma. Cells use oxygen, hydrogen (from water), and carbon (from glucose) to make energy (ATP).
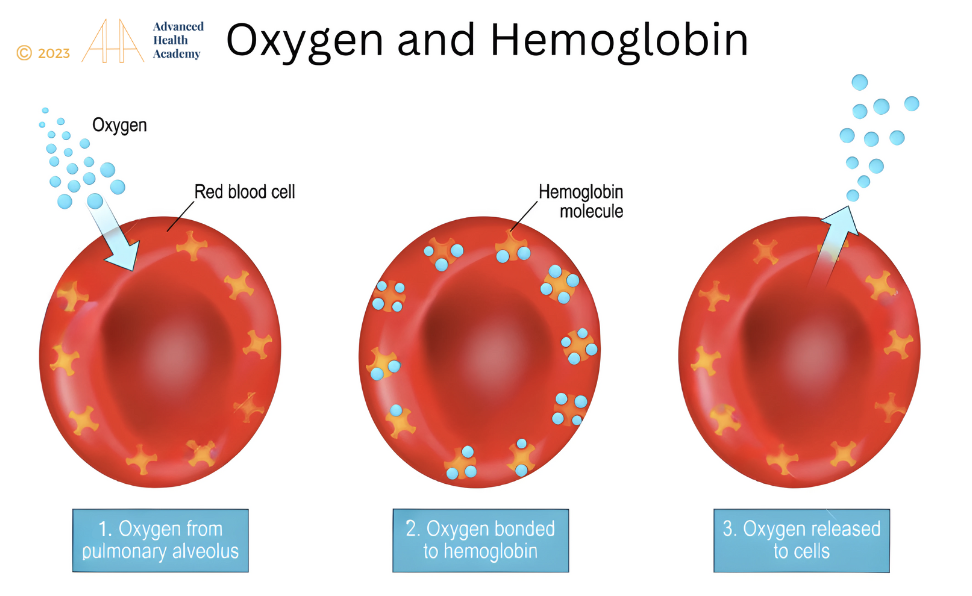
Figure 5: Oxygen binds to hemoglobin in red blood cells and is transported to tissue throughout the body.
In the bone marrow, red blood cells (RBCs) make hemoglobin (Hb) but lack a nucleus and mitochondria to save space for Hb and avoid using oxygen for energy. Once in the bloodstream, the Hb level stays the same throughout their lifespan.
Regulation of Hemoglobin Glycation (HbA1c)
Hemoglobin (Hb) glycation is influenced by how the body makes energy, mainly through glycolysis, which uses food to create ATP. During fasting, exercise, or insulin shortage (as in diabetes), the body breaks down fats and proteins into amino acids, lactic acid, and glycerol for energy. This process, called ketogenesis, mostly happens in the liver. The brain can’t use fat for energy, so glycerol is turned into glucose via gluconeogenesis.
When sugars attach to hemoglobin, it can reduce oxygen delivery to tissues, causing red blood cells (RBCs) to break down faster. Higher HbA1c levels, common in diabetes, make blood thicker and worsen oxygen shortage.
Harvesting Energy After A Meal
After eating, food is broken down, releasing glucose, fatty acids, and amino acids into the blood. Insulin helps glucose enter cells for energy, while extra carbs, fats, and proteins go to the liver for storage or conversion into energy. Waste products are detoxified by the liver.
Harvesting Energy During Short-Term Fasting and Intense Emotions
During fasting or stress, hormones like glucagon and adrenaline are released to break down stored energy. The liver and other tissues release glucose and fat, which are turned into ketones for energy.
Harvesting Energy During Low Energy States, such as Starvation and Intense Exercise
When glycogen is low, like during starvation or intense exercise, the body breaks down fat and protein into glucose for energy. This helps provide fuel when food is scarce.
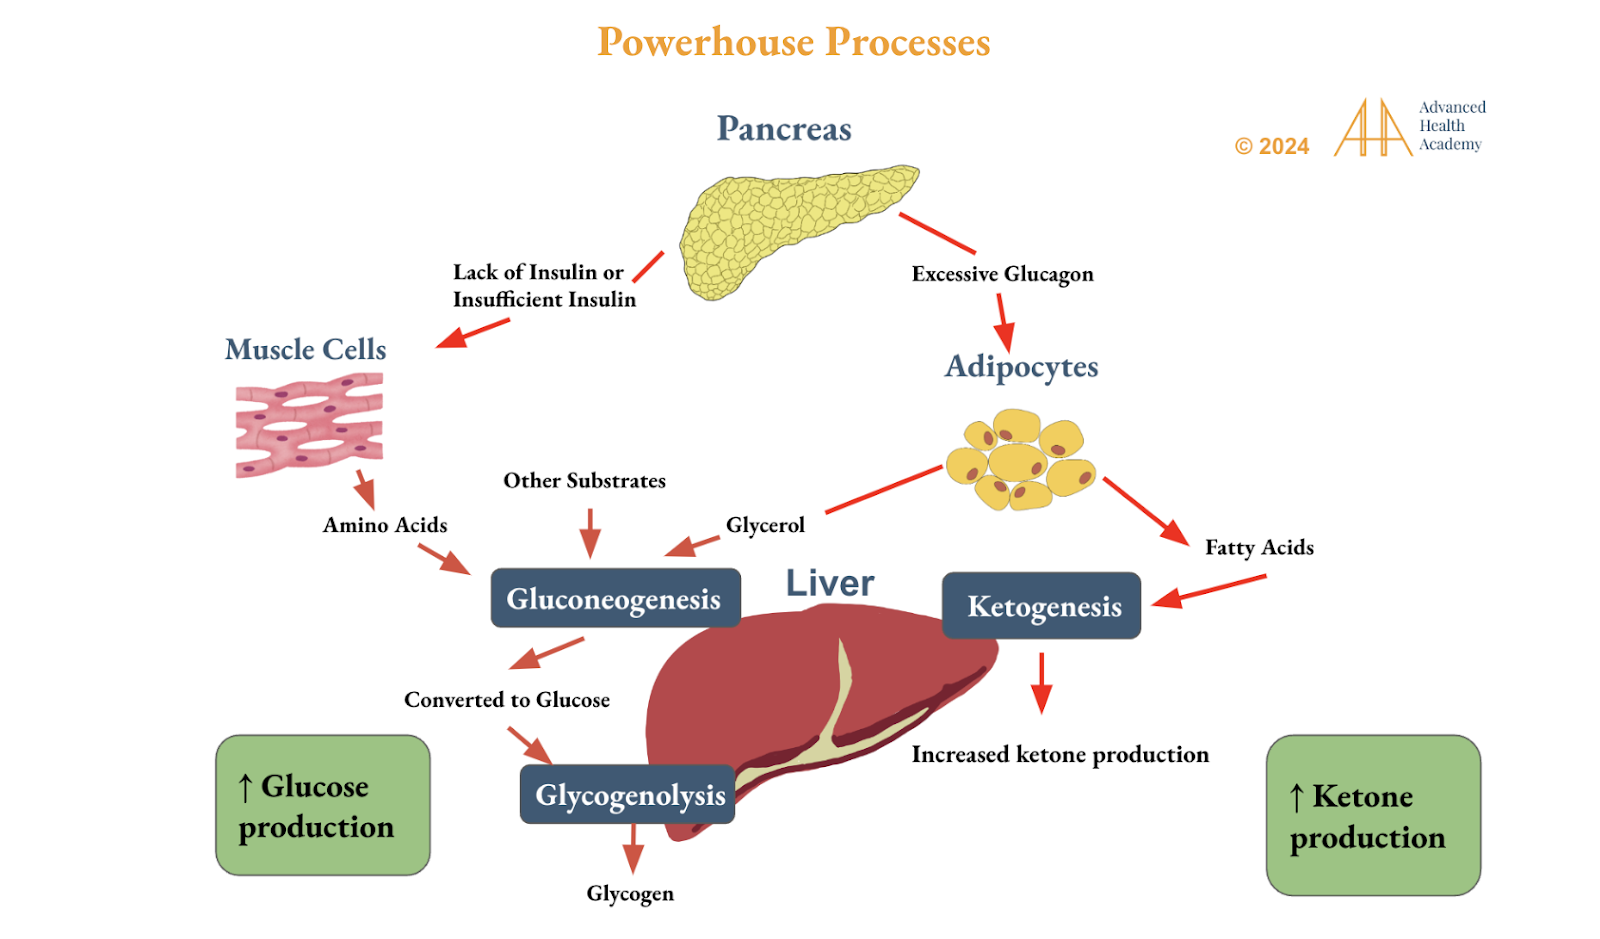
Figure 6: Circadian rhythm genes control glucose and ketone production in the liver to manage energy. Fat, muscle, and liver cells use nutrients to make ATP. Ketones help provide energy during fasting or exercise, balance blood sugar, and improve insulin sensitivity, reducing hunger, anxiety, and stress.
Pathophysiology of Abnormal HbA1c Levels
High hemoglobin (Hb) glycation increases HbA1c levels, reducing oxygen to tissues and affecting body functions. This is often caused by poor lifestyle choices that prevent fat breakdown for energy. Low HbA1c is usually not a concern, especially with balanced cholesterol and hormones.
Figure 7 shows that abnormal HbA1c levels are linked to gut imbalances and poor blood flow. When food stays too long in the stomach, it reduces healthy bacteria, leading to nutrient deficiencies and metabolic problems. This causes undigested food and waste to enter the bloodstream, thickening blood and lowering oxygen delivery. The body compensates by making more red blood cells, and the liver stores fat instead of using it for energy.
Chronic gut imbalances reduce energy and increase reactive oxygen species (ROS), which damage red blood cells and trigger inflammation. This leads to the immune system attacking the body, causing autoimmune diseases and organ damage. Abnormal HbA1c levels are linked to inflammation, raising the risk of obesity, diabetes, hormonal issues, heart disease, autoimmune diseases, infections, and cancer.
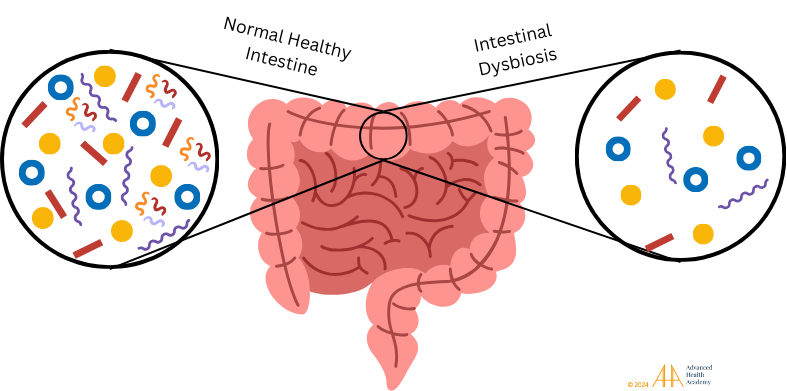
Figure 7: Healthy gut bacteria aid digestion, nutrient absorption, and waste removal. Dysbiosis occurs when there are fewer healthy bacteria, disrupting metabolism and boosting harmful pathogens that affect immunity .
Dysbiosis (gut bacteria imbalance) disrupts the body’s ability to process nutrients and produce important molecules. This leads to undigested food and waste entering the bloodstream, thickening blood and reducing oxygen delivery. The kidneys make erythropoietin (EPO), prompting the bone marrow to produce more red blood cells (RBCs), while the liver stores fat instead of using it for energy.
Chronic dysbiosis lowers energy and increases harmful molecules called reactive oxygen species (ROS). ROS damage RBCs, cause inflammation, and lead to autoimmune diseases. White blood cells may attack the body’s own tissues. Abnormal HbA1c levels are linked to chronic inflammation, raising the risk of obesity, diabetes, hormone imbalances, heart disease, autoimmune disorders, infections, cancer, and organ damage.
High HbA1c Levels
High HbA1c levels lead to dehydration, shrinking red blood cells (RBCs), and reduced oxygen delivery to tissues. Chronic dehydration can lower gut bacteria diversity (dysbiosis), affecting nutrient absorption and cell production. This results in a higher concentration of RBC byproducts, like free hemoglobin and iron, in the blood. The immune system releases reactive oxygen species (ROS) to clear debris, prevent bleeding, and support wound healing.
When oxygen levels drop, heme (from hemoglobin) reduces the production of heme and hemoglobin, affecting energy production and increasing ROS and inflammation. ROS damage RBCs, causing hemolysis and releasing iron, which harms cells and raises the production of proteins like hepcidin and ferritin to regulate iron levels. High iron can damage organs and disrupt hormone production, including insulin and glucagon, affecting energy use and glucose uptake.
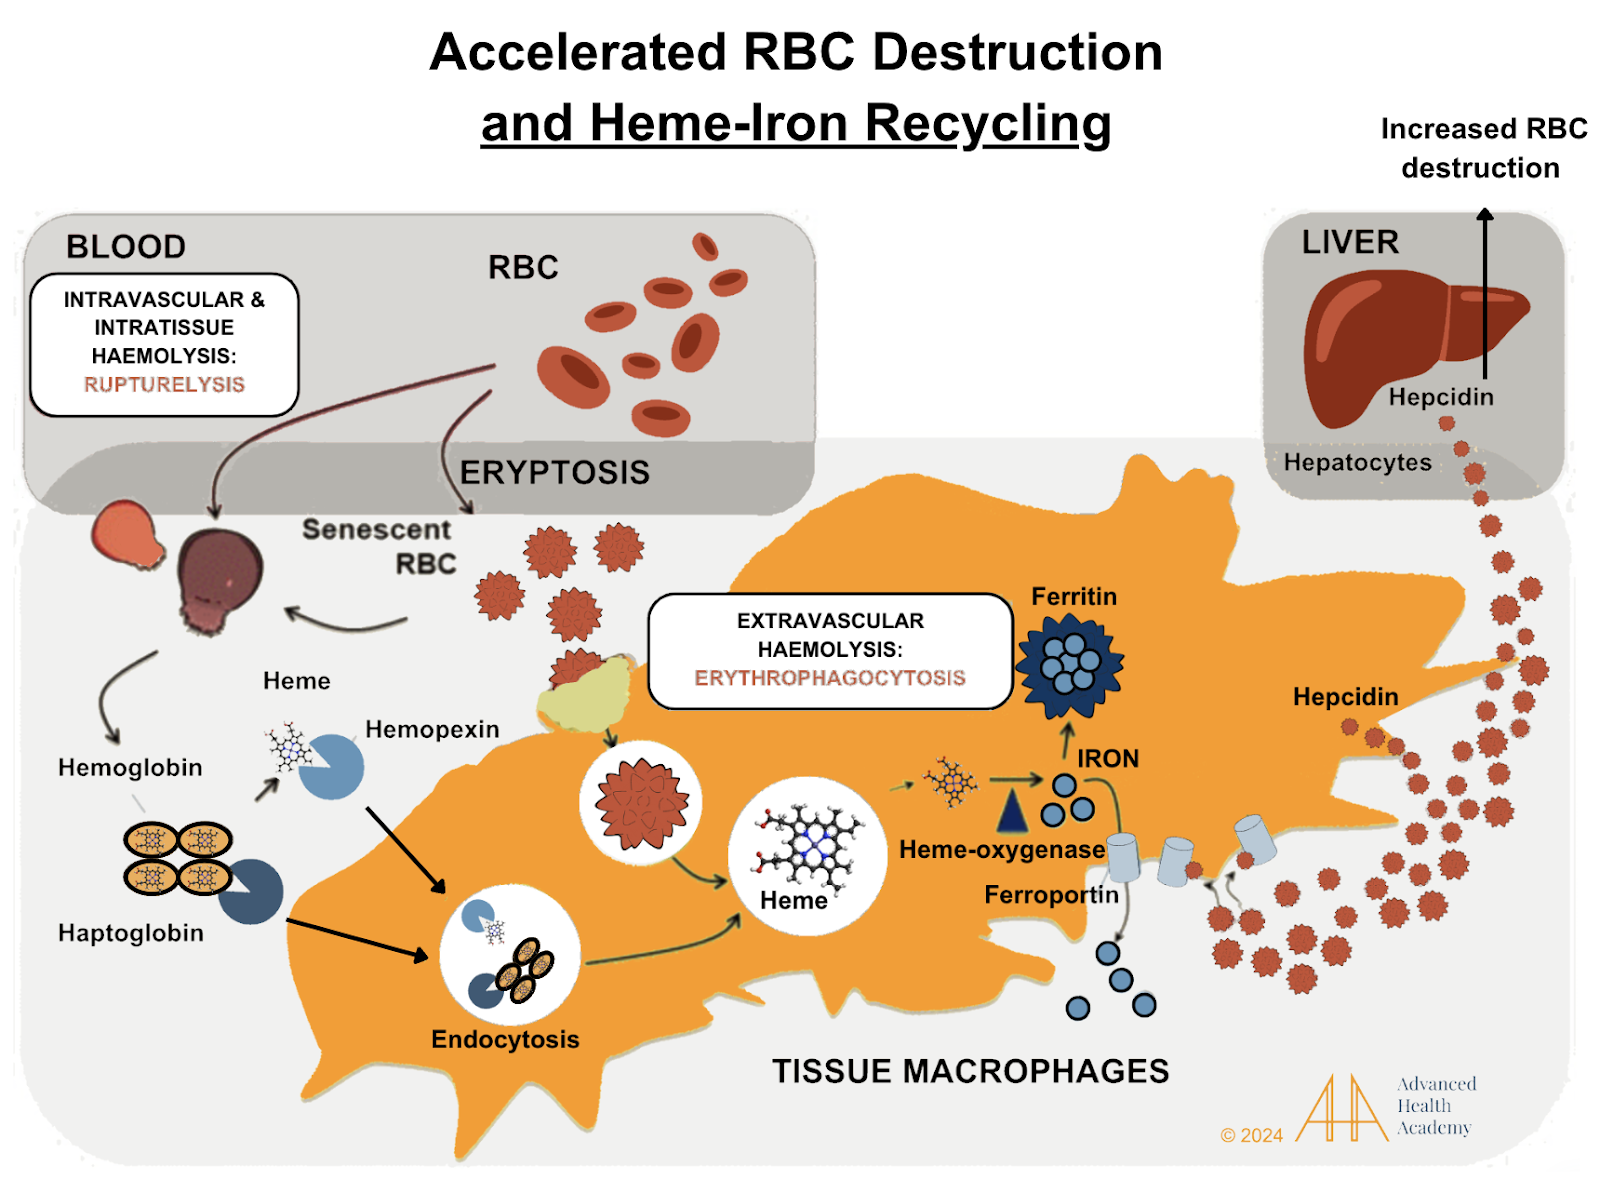
Figure 8: When red blood cells (RBCs) are destroyed (hemolysis), toxic byproducts like hemoglobin and iron are released into the blood. Transport proteins (haptoglobin and hemopexin) carry them to the liver and spleen, where macrophages break them down.Heme is turned into iron, which is stored or transported into the blood. It’s stored in organs like the pancreas and muscles. Heme is also converted to bilirubin in the liver and either stored in bile or excreted in stool/urine. Globulin is recycled by the liver to make new proteins.
Hemolysis also causes cholesterol to build up in blood vessels, leading to atherosclerosis, a process that helps repair injured vessels. High HbA1c levels are linked to excess fat and iron in organs like the liver, pancreas, and kidneys, impairing their function. This damages the ability to produce hormones, like insulin, and increases blood glucose levels, which worsens HbA1c.
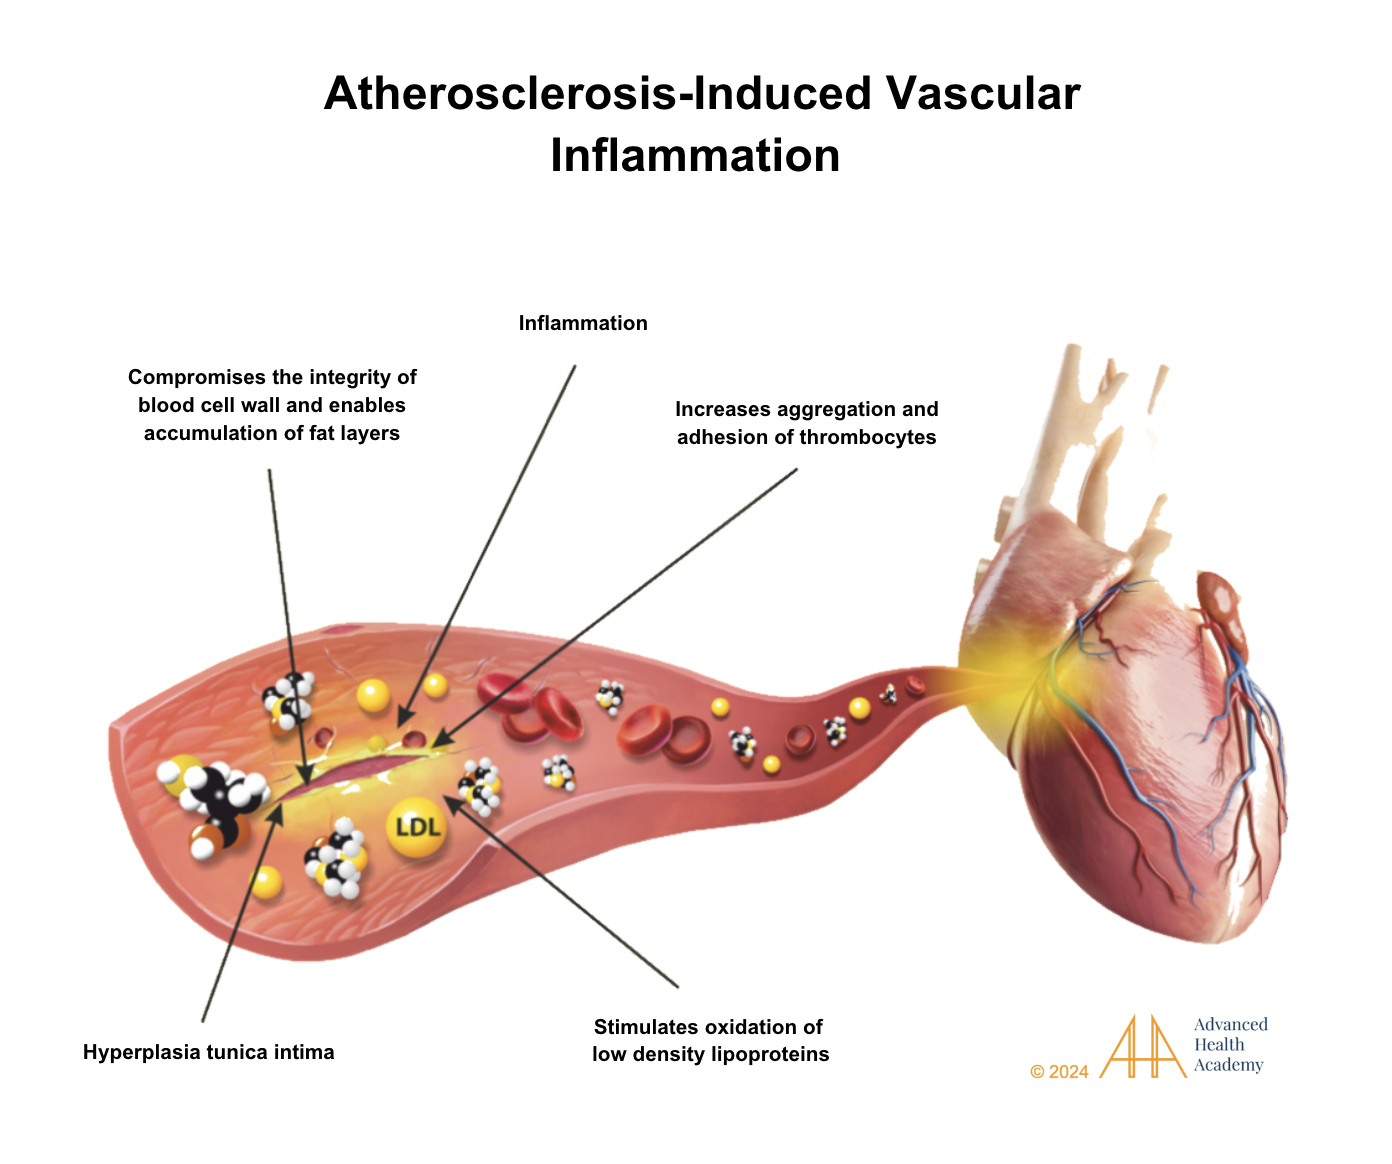
Figure 9: Atherosclerosis causes artery thickening (tunica intima hyperplasia) and clot formation by platelets. Macrophages ingest oxidized LDL cholesterol, becoming foam cells that release inflammatory proteins and ROS. Chronic inflammation increases white blood cells and platelets, damaging cells and microbiota, reducing organ function, and raising the risk of health issues.
Rising HbA1c levels are related to:
Increased undigested food and waste in the bloodstream, damaging RBCs and accelerating their destruction.
Dysbiosis, which causes nutrient deficiencies and affects RBC production.
Excess fat and iron stores reducing energy production.
Increased ROS that damage tissues and mutate genes.
Overactive white blood cells (WBCs) and platelets that focus on tissue repair instead of fighting infections or tumors.
Chronic stress response overstimulation, leading to hormonal imbalances and increased risk for autoimmune endocrine disorders like Hashimoto’s disease, Graves’ disease, and diabetes.
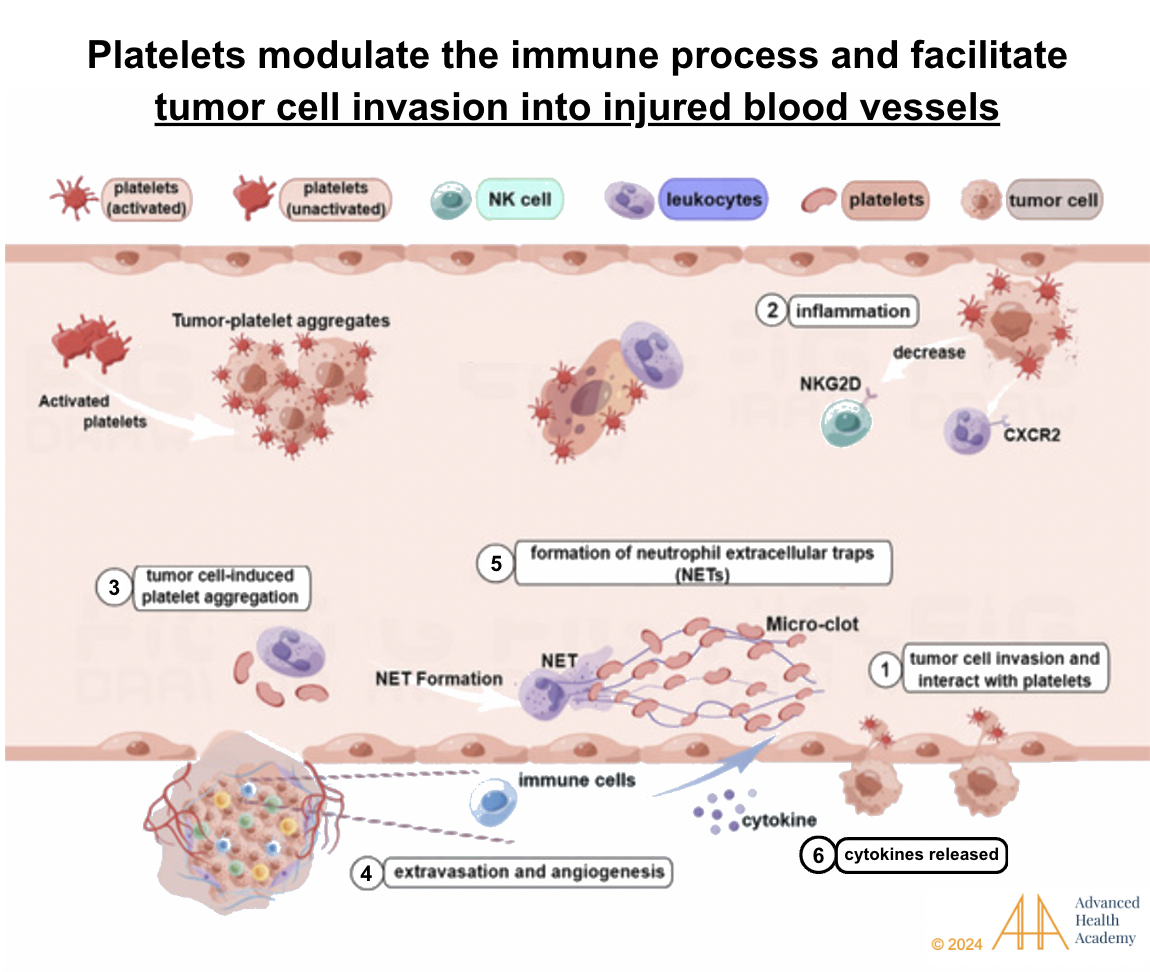
Figure 10: Rising HbA1c is closely linked to excess concentration of proinflammatory proteins, oxidized cholesterol, and reactive oxygen species in the circulation damaging tissues, thereby forcing white blood cells (leukocytes) and platelets (thrombocytes) to work with pathogens, and tumor cells to repair injuries and clear out tissue debris.
Tumor cells and pathogens are recruited by platelets to ingest free hemin and iron, respectively, enabling them to reproduce and migrate (1). Neutrophils focus on stabilizing the integrity and function of the blood vessel by releasing proinflammatory proteins (2)40 and tumor cell-induced platelet activation (3) and formation of new blood vessels (angiogenesis) (4). Natural killer (NK) cells are prevented from ingesting and destroying tumor cells and pathogens (5) . Thus, the cytokines released enable pathogens to produce toxins that damage red blood cell membranes, steal nutrients (like iron and oxygen) from other organs, and induce infections and tumor growth (6).
These conditions can cause symptoms like irregular periods, infertility, fatigue, poor bone health, skin issues, and more. For example, weakened collagen due to low blood flow can cause bone density loss, dry skin, and slow healing.
Low HbA1c Levels
Abnormally low HbA1c levels (<4.0%) can indicate problems like shortened red blood cell (RBC) lifespan, increased RBC destruction, and reduced energy production, which can raise the risk of illness and death. Low HbA1c may appear similar to high HbA1c, and younger RBCs, which are larger, can affect HbA1c and RBC distribution width (RDW). An abnormal RDW is linked to higher risks of illness, death, and inflammation.
Low HbA1c can be caused by several factors:
Overuse of blood sugar-lowering drugs: These drugs can cause low blood sugar (hypoglycemia) and reduce HbA1c levels, affecting hormones that control metabolism and oxygen delivery, leading to decreased energy production and increased free radicals (ROS).
Antibiotic use: Frequent antibiotics can lower gut bacteria diversity (dysbiosis), leading to nutrient deficiencies that reduce RBC and hemoglobin production, lowering HbA1c.
Dehydration: Dehydration increases blood ion concentration, causing RBCs to shrink, reducing oxygen delivery to cells (hypoxia). This speeds up RBC destruction and lowers HbA1c levels.
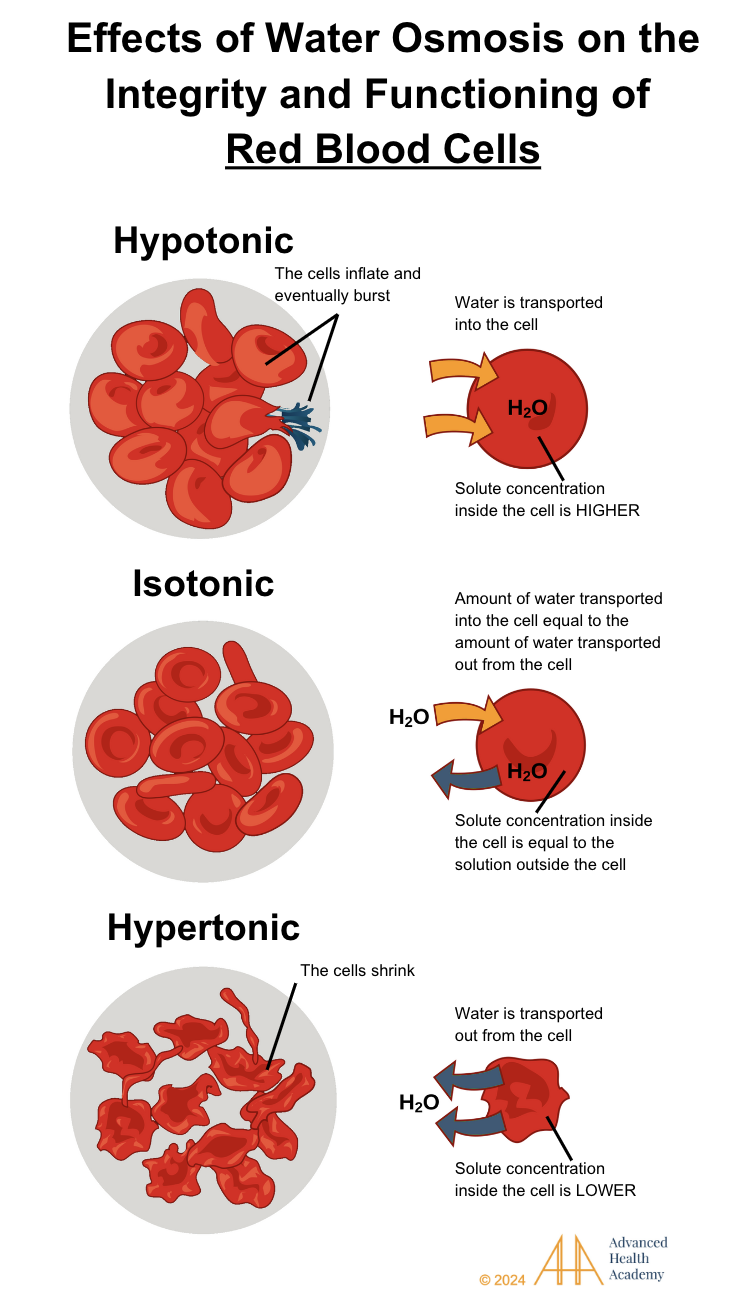
Figure 11: Effects of water osmosis on the integrity and functioning of blood cells. Water osmosis is the transportation of water throughout a cell that is determined by the cell’s solute concentration. Hypotonic cells have a higher solute concentration inside the cell than outside of the cell causing more water to be transported inside of the cell. Isotonic cells have the same solute concentration inside the cell and outside the cell causing water to be transported into and out from the cell equally. Hypertonic cells have less solute concentration inside the cell causing the cell to transport water out of the cell.
Other causes of fluid loss that lower HbA1c include:
Slow blood loss, often from heavy periods or conditions like anemia and chronic digestive disorders (e.g., inflammatory bowel disease).
Excessive blood loss during surgery or trauma.
Frequent blood donations or blood draws.
These factors can lower HbA1c, reducing energy production and increasing glucose synthesis and ROS production.
Prevalence and Statistics of Abnormal HbA1c Levels
Both high and low HbA1c levels signal health issues, mostly linked to diabetes. High HbA1c (above 5.7%) and low HbA1c (below 4.0%) are influenced by poor diet, lack of exercise, obesity, and medication. Diabetes affects 38.4 million people worldwide, with 10.5% of adults having the disease, half of whom are unaware. Diabetes increases the risk of heart attack, stroke, and kidney disease. The number of people with diabetes is expected to rise to 643 million by 2030 and 783 million by 2045 .
High HbA1c levels usually indicate diabetes and a higher risk of heart disease, stroke, and kidney damage. Type 2 diabetes is increasing in American Indian youth due to poor blood sugar control, lack of exercise, and bad nutrition. 67
Low HbA1c levels can signal hypoglycemia or issues with red blood cells. While less common, low levels increase the risk of death, liver disease, and bleeding. In the U.S., people with low HbA1c have nearly three times the risk of death compared to those with normal levels 46.
Conclusion
Interpreting HbA1c tests requires considering factors like age, lifestyle, medications, and conditions that affect digestion and metabolism. Other tests may help identify the cause of abnormal results related to glucose, red blood cells, nutrient absorption, and organ function.
To manage abnormal HbA1c levels, lifestyle changes, medication adjustments, and stress reduction are important. If these don’t work, medications may be needed to prevent complications.
Poor diet, sleep issues, and stress can reduce blood flow to organs, causing nutrient deficiencies and lowering HbA1c levels temporarily. A healthy, plant-based diet, regular exercise, stress management, and 7-9 hours of sleep for adults and 10-12 hours for children are crucial for balancing HbA1c and blood glucose levels.
Source References and Supplemental Research
Gilstrap LG, Chernew ME, Nguyen CA, et al. Association Between Clinical Practice Group Adherence to Quality Measures and Adverse Outcomes Among Adult Patients With Diabetes. JAMA Network Open. 2019;2(8):e199139. Published 2019 Aug 2. doi:10.1001/jamanetworkopen.2019.9139 [PubMed] [JAMA] [Full Text]
Eyth E, Naik R. Hemoglobin A1C. PubMed. Published 2021. https://www.ncbi.nlm.nih.gov/books/NBK549816/# [PubMed]
Bhutta R, Syed N, Ahmad A, Khan S. Hemoglobin: – Part 1 – Hemoglobin (Hb) structure and Functions Labpedia.net. Labpedia. Published January 25, 2020. [Lapedia]
medtextfree. CHAPTER 28 STRUCTURE AND FUNCTION OF HEMOGLOBIN. Free Medical Textbook. Published December 26, 2011. [Free Medical Textbook]
Billett H. Chapter 151 Hemoglobin and Hematocrit. Clinical Methods: The History, Physical, and Laboratory Examinations. 3rd edition. Boston: Butterworths; 1990. [PubMed]
Adamson J. Erythropoietin, iron metabolism, and red blood cell production. Semin Hematol. 1996;33(2 Suppl 2):5-9. [PubMed]Perutz, M. F., Rossmann, M. G., Cullis, A. F., Muirhead, H., Will, G., & North, A. C. (1960). Structure of hemoglobin: a three-dimensional Fourier synthesis at 5.5-A. resolution, obtained by X-ray analysis. Nature, 185(4711), 416–422. https://doi.org/10.1038/185416a0 [PubMed] [Nature Portfolio]
Perutz, M. F., Rossmann, M. G., Cullis, A. F., Muirhead, H., Will, G., & North, A. C. (1960). Structure of hemoglobin: a three-dimensional Fourier synthesis at 5.5-A. resolution, obtained by X-ray analysis. Nature, 185(4711), 416–422. https://doi.org/10.1038/185416a0 [PubMed] [Nature Portfolio]
White, Hayden; Venkatesh, Balasubramanian (2011). “Clinical review: Ketones and brain injury.” Critical Care. 15 (2): 219. doi:10.1186/cc10020. [PubMed] [BMC] [Full Text]
Raczuk, E., Dmochowska, B., Samaszko-Fiertek, J., & Madaj, J. (2022). Different Schiff Bases-Structure, Importance and Classification. Molecules (Basel, Switzerland), 27(3), 787. https://doi.org/10.3390/molecules27030787 [PubMed]
Rahbar S. (2005). The discovery of glycated hemoglobin: a major event in the study of nonenzymatic chemistry in biological systems. Annals of the New York Academy of Sciences, 1043, 9–19. https://doi.org/10.1196/annals.1333.002 [PubMed] [Wiley]
Ogun, A. S., Joy, N. V., & Valentine, M. (2023, May 1). Biochemistry, Heme Synthesis. StatPearls – NCBI Bookshelf. https://www.ncbi.nlm.nih.gov/books/NBK537329/ [PubMed]
American Diabetes Association (2021). 6. Glycemic Targets: Standards of Medical Care in Diabetes-2021. Diabetes care, 44(Suppl 1), S73–S84. https://doi.org/10.2337/dc21-S006 [PubMed] [American Diabetes Association]
Sherwani, S. I., Khan, H. A., Ekhzaimy, A., Masood, A., & Sakharkar, M. K. (2016). Significance of HbA1c Test in Diagnosis and Prognosis of Diabetic Patients. Biomarker insights, 11, 95–104. https://doi.org/10.4137/BMI.S38440 [PubMed]
Rui L. Energy metabolism in the liver. Compr Physiol. 2014;4(1):177-197. doi:10.1002/cphy.c130024 [PubMed][CrossRef]
Volek JS, Sharman MJ, Love DM, Avery NG, Gómez AL, Scheett TP, Kraemer WJ. Body composition and hormonal responses to a carbohydrate-restricted diet. Metabolism. 2002 Jul;51(7):864-70. [PubMed]
Branco AF, et al. Ketogenic diets: from cancer to mitochondrial diseases and beyond. Eur J Clin Invest. 2016 Mar;46(3):285-98. doi: 10.1111/eci.12591.[PubMed]
Paoli A, Bianco A, Damiani E, Bosco G. Ketogenic diet in neuromuscular and neurodegenerative diseases. Biomed Res Int. 2014;2014:474296. doi: 10.1155/2014/474296.[PubMed]
Maalouf M, Rho JM, Mattson MP. The neuroprotective properties of calorie restriction, the ketogenic diet, and ketone bodies. Brain Res Rev. 2009 Mar;59(2):293-315. doi: 10.1016/j.brainresrev.2008.09.002.[PMC]
Reddy, S., Ramsubeik, K., Vega, K. J., Federico, J., & Palacio, C. (2010). Do HbA1C Levels Correlate With Delayed Gastric Emptying in Diabetic Patients?. Journal of neurogastroenterology and motility, 16(4), 414–417. https://doi.org/10.5056/jnm.2010.16.4.414 [JNM]
Abumrad NA, Davidson NO. Role of the gut in lipid homeostasis. Physiol Rev 2012; 92:1061-1085 [PMC free article] [PubMed]
What Is Gut Dysbiosis? Cleveland Clinic. [Cleveland Clinic]
Wilson J.G., Lindquist J.H., Grambow S.C., Crook E.D., Maher J.F. Potential role of increased iron stores in diabetes. Am. J. Med. Sci. 2003;325:332–339. doi: 10.1097/00000441-200306000-00004. [PubMed] [CrossRef] [Google Scholar]
Tiedge M., Lortz S., Drinkgern J., Lenzen S. Relation between antioxidant enzyme gene expression and antioxidative defense status of insulin-producing cells. Diabetes. 1997;46:1733–1742. doi: 10.2337/diab.46.11.1733. [PubMed] [CrossRef] [Google Scholar]
Dludla P.V., Joubert E., Muller C.J.F., Louw J., Johnson R. Hyperglycemia-induced oxidative stress and heart disease-cardioprotective effects of rooibos flavonoids and phenylpyruvic acid-2-O-beta-D-glucoside. Nutr. Metab. 2017;14:45. doi: 10.1186/s12986-017-0200-8. [PMC free article] [PubMed] [CrossRef] [Google Scholar].
Žiberna, L., Jenko-Pražnikar, Z., & Petelin, A. (2021). Serum Bilirubin Levels in Overweight and Obese Individuals: The Importance of Anti-Inflammatory and Antioxidant Responses. Antioxidants (Basel, Switzerland), 10(9), 1352. https://doi.org/10.3390/antiox10091352 [PubMed] [MDPI] [PubMed]
Chen, L., Deng, H., Cui, H., Fang, J., Zuo, Z., Deng, J., Li, Y., Wang, X., & Zhao, L. (2017). Inflammatory responses and inflammation-associated diseases in organs. Oncotarget, 9(6), 7204–7218. https://doi.org/10.18632/oncotarget.23208 [Oncotarget]
Emanuelsson, F., Nordestgaard, B. G., & Benn, M. (2018). Familial hypercholesterolemia and risk of peripheral arterial disease and chronic kidney disease. The Journal of Clinical Endocrinology & Metabolism, 103(12), 4491–4500. https://doi.org/10.1210/jc.2018-01058 [CrossRef] [Google Scholar] [Scopus]
Singh A, Koritala T, Jialal I. Unconjugated Hyperbilirubinemia. [Updated 2023 Feb 20]. In: StatPearls [Internet]. Treasure Island (FL): StatPearls Publishing; 2024 Jan-. [PubMed]
Hom, J., Dulmovits, B. M., Mohandas, N., & Blanc, L. (2015). The erythroblastic island as an emerging paradigm in the anemia of inflammation. Immunologic research, 63(1-3), 75–89. https://doi.org/10.1007/s12026-015-8697-2 [PubMed]
Chung, J., Chen, C., & Paw, B. H. (2012). Heme metabolism and erythropoiesis. Current opinion in hematology, 19(3), 156–162. https://doi.org/10.1097/MOH.0b013e328351c48b [PubMed] [Full Text] [PubMed]
Ravasi G, Pelucchi S, Greni F, et al. Circulating factors are involved in hypoxia-induced hepcidin suppression. Blood Cells Mol Dis. 2014;53(4):204-210. doi:10.1016/j.bcmd.2014.06.006 [PubMed] [Elsevier]
Nemeth E, Valore EV, Territo M, Schiller G, Lichtenstein A, Ganz T. Hepcidin, a putative mediator of anemia of inflammation, is a type II acute-phase protein. Blood. 2003;101(7):2461-2463. doi:10.1182/blood-2002-10-3235 [PubMed] [Elsevier]
Weiss G. Iron metabolism in the anemia of chronic disease. Biochim Biophys Acta. 2009;1790(7):682-693. doi:10.1016/j.bbagen.2008.08.006 [PubMed] [Elsevier]
Weiss, G., & Goodnough, L. T. (2005). Anemia of chronic disease. The New England journal of medicine, 352(10), 1011–1023. https://doi.org/10.1056/NEJMra041809 [PubMed] [NEJM]
Liao YF, Zhu W, Li DP, Zhu X. Heme oxygenase-1 and gut ischemia/reperfusion injury: A short review. World J Gastroenterol. 2013;19(23):3555-3561. doi:10.3748/wjg.v19.i23.3555 [PMC Full Text] [PubMed] [Crosslink]
Fevery J, Blanckaert N, Heirwegh KP, Préaux AM, Berthelot P. Unconjugated bilirubin and an increased proportion of bilirubin monoconjugates in the bile of patients with Gilbert’s syndrome and Crigler-Najjar disease. J Clin Invest. 1977;60(5):970–979. [PMC free article] [PubMed] [Google Scholar]
Song Y, Liu J, Zhao K, Gao L, Zhao J. Cholesterol-induced toxicity: An integrated view of the role of cholesterol in multiple diseases. Cell Metabolism. 2021;33(10):1911-1925. doi:10.1016/j.cmet.2021.09.001 [Elsevier]
Adiels M, Olofsson SO, Taskinen MR, Borén J. Overproduction of very low-density lipoproteins is the hallmark of the dyslipidemia in the metabolic syndrome. Arterioscler Thromb Vasc Biol. 2008;28(7):1225-1236. doi:10.1161/ATVBAHA.107.160192 [PubMed] [Full Text]
Chen P, Poddar R, Tipa EV, et al. Homocysteine metabolism in cardiovascular cells and tissues: implications for hyperhomocysteinemia and cardiovascular disease. Adv Enzyme Regul. 1999:39:93-109. PMID: 10470368 DOI: 10.1016/s0065-2571(98)00029-6. [PubMed]
Setién-Suero E, Suárez-Pinilla M, Suárez-Pinilla P, Benedicto Crespo-Facorro, Ayesa-Arriola R. Homocysteine and cognition: A systematic review of 111 studies. 2016;69:280-298. doi:https://doi.org/10.1016/j.neubiorev.2016.08.014 [Elsevier]
Schaffer A, Verdoia M, Cassetti E, et al. Relationship between homocysteine and coronary artery disease. Results from a large prospective cohort study. Thromb Res. 2014;134(2):288-293. doi:10.1016/j.thromres.2014.05.025 [PubMed] [Elsevier]
Perna AF, Ingrosso D. Atherosclerosis determinants in renal disease: how much is homocysteine involved?. Nephrol Dial Transplant. 2016;31(6):860-863. doi:10.1093/ndt/gfv409 [PubMed] [Oxford Academic]
Kioukia N, Bekris S, Antoniou K, Papadopoulou-Daifoti Z, Christofidis I. Effects of chronic mild stress (CMS) on thyroid hormone function in two rat strains. Psychoneuroendocrinology. 2000;25(3):247-257. doi:10.1016/s0306-4530(99)00051-7 [PubMed] [Elsevier]
Helmreich DL, Tylee D. Thyroid hormone regulation by stress and behavioral differences in adult male rats. Horm Behav. 2011;60(3):284-291. doi:10.1016/j.yhbeh.2011.06.003 [PubMed] [PMC Full Text] [Elsevier]
Jiao, H., Xiao, E., & Graves, D. T. (2015). Diabetes and Its Effect on Bone and Fracture Healing. Current osteoporosis reports, 13(5), 327–335. https://doi.org/10.1007/s11914-015-0286-8 [Springer]
Carson, A. P., Fox, C. S., McGuire, D. K., Levitan, E. B., Laclaustra, M., Mann, D. M., & Muntner, P. (2010). Low hemoglobin A1c and risk of all-cause mortality among US adults without diabetes. Circulation. Cardiovascular quality and outcomes, 3(6), 661–667. https://doi.org/10.1161/CIRCOUTCOMES.110.957936 [PubMed]
Patel KV, Ferrucci L, Ershler WB, Longo DL, Guralnik JM. Red blood cell distribution width and the risk of death in middle-aged and older adults. Arch Intern Med. 2009;169(5):515-523. doi:10.1001/archinternmed.2009.11 [PubMed] [PMC Full Text] [JAMA]
Little RR, Sacks DB. HbA1c: how do we measure it and what does it mean?. Curr Opin Endocrinol Diabetes Obes. 2009;16(2):113-118. doi:10.1097/MED.0b013e328327728d [PubMed] [Full Text]
Cohen RM, Franco RS, Khera PK, et al. Red cell life span heterogeneity in hematologically normal people is sufficient to alter HbA1c. Blood. 2008;112(10):4284-4291. doi:10.1182/blood-2008-04-154112 [PubMed]
Felker GM, Allen LA, Pocock SJ, et al. Red cell distribution width as a novel prognostic marker in heart failure: data from the CHARM Program and the Duke Databank. J Am Coll Cardiol. 2007;50(1):40-47. doi:10.1016/j.jacc.2007.02.067 [PubMed] [Elsevier]
Perlstein TS, Weuve J, Pfeffer MA, Beckman JA. Red blood cell distribution width and mortality risk in a community-based prospective cohort. Arch Intern Med. 2009;169(6):588-594. doi:10.1001/archinternmed.2009.55 [PubMed] [Full Text] [JAMA]
Tonelli M, Sacks F, Arnold M, et al. Relation Between Red Blood Cell Distribution Width and Cardiovascular Event Rate in People With Coronary Disease. Circulation. 2008;117(2):163-168. doi:10.1161/CIRCULATIONAHA.107.727545 [PubMed] [Full Text]
Lebovitz HE. Oral therapies for diabetic hyperglycemia. Endocrinol Metab Clin North Am. 2001;30(4):909-933. doi:10.1016/s0889-8529(05)70221-8 [PubMed] [Elsevier]
Scheen AJ. Pharmacokinetic and toxicological considerations for the treatment of diabetes in patients with liver disease. Expert Opin Drug Metab Toxicol. 2014;10(6):839-857. doi:10.1517/17425255.2014.902444 [PubMed] [Full Text] [ORBI]
Delcò F, Tchambaz L, Schlienger R, Drewe J, Krähenbühl S. Dose adjustment in patients with liver disease. Drug Saf. 2005;28(6):529-545. doi:10.2165/00002018-200528060-00005 [PubMed] [Springer]
Baumann H, Gauldie J. Regulation of hepatic acute phase plasma protein genes by hepatocyte stimulating factors and other mediators of inflammation. Mol Biol Med. 1990;7(2):147-159. [PubMed]
Whicher JT, Westacott CI. The acute phase response. In: Whicher JT, Evans SW, editors. Biochemistry of Inflammation. London: Kluwer Academic; 1992. pp. 243–71. [Springer]
Unnikrishnan R, Anjana RM, Mohan V. Drugs affecting HbA1c levels. Indian J Endocrinol Metab. 2012;16(4):528-531. doi:10.4103/2230-8210.98004 [PubMed]
Ramsay DJ. Homeostatic control of water balance. In: Arnaud MJ, editor. Hydration Throughout Life. Montrouge: John Libbey Eurotext; 1998. pp. 9–18. [Google Scholar]
Baierle, M., Nascimento, S. N., Moro, A. M., Brucker, N., Freitas, F., Gauer, B., Durgante, J., Bordignon, S., Zibetti, M., Trentini, C. M., Duarte, M. M., Grune, T., Breusing, N., & Garcia, S. C. (2015). Relationship between inflammation and oxidative stress and cognitive decline in the institutionalized elderly. Oxidative medicine and cellular longevity, 2015, 804198. https://doi.org/10.1155/2015/804198 [PubMed]
Sayer, A. A., Dennison, E. M., Syddall, H. E., Gilbody, H. J., Phillips, D. I. W., & Cooper, C. (2005, October 1). Type 2 diabetes, muscle strength, and impaired physical function: The tip of the iceberg?. American Diabetes Association. [ADA]
The medical minute: Consider your A1C levels to monitor heart health. Penn State Health News. (2023, February 10). [Penn State Health News]
Testing for diabetes and prediabetes: A1C. (2024, May 15). Diabetes. https://www.cdc.gov/diabetes/diabetes-testing/prediabetes-a1c-test.html [CDC]
CDC. National Diabetes Statistics Report. Diabetes. Published June 6, 2024. [CDC]
U.S. Department of Health and Human Services. (n.d.). What is diabetic neuropathy? – niddk. National Institute of Diabetes and Digestive and Kidney Diseases. [NIH]
Varghese, R. T., & Jialal, I. (2023, July 24). Diabetic nephropathy. StatPearls – NCBI Bookshelf. https://www.ncbi.nlm.nih.gov/books/NBK534200/ [PubMed]
Vijayakumar, P., Nelson, R. G., Hanson, R. L., Knowler, W. C., & Sinha, M. (2016, November 3). HbA1c and the prediction of type 2 diabetes in children and adults. American Diabetes Association. [ADA]
Facts & figures. International Diabetes Federation. (2024b, May 7). https://idf.org/about-diabetes/diabetes-facts-figures/ [IDF]
Wang, P. (2017, January 30). What clinical laboratorians should do in response to extremely low hemoglobin A1C results. OUP Academic. [Oxford Academic]
Kiniwa N, Okumiya T, Tokuhiro S, Matsumura Y, Matsui H, Koga M. Hemolysis causes a decrease in HbA1c level but not in glycated albumin or 1,5-anhydroglucitol level. Scand J Clin Lab Invest. 2019;79(6):377-380. doi:10.1080/00365513.2019.1627577 [PubMed] [Full Text]
Hooda J, Shah A, Zhang L. Heme, an essential nutrient from dietary proteins, critically impacts diverse physiological and pathological processes. Nutrients. 2014;6(3):1080-1102. Published 2014 Mar 13. doi:10.3390/nu6031080 [PubMed]
Sritharan M (July 2006). “Iron and bacterial virulence”. Indian J Med Microbiol. 24 (3): 163–4. doi:10.1016/S0255-0857(21)02343-4. PMID 16912433. [PubMed]
Yi J, Thomas LM, Musayev FN, Safo MK, Richter-Addo GB. Crystallographic trapping of heme loss intermediates during the nitrite-induced degradation of human hemoglobin. Biochemistry. 2011;50(39):8323-8332. doi:10.1021/bi2009322 and RCSB PDB [PubMed]
Hubbard SR, Hendrickson WA, Lambright DG, Boxer SG. X-ray crystal structure of a recombinant human myoglobin mutant at 2.8 A resolution. J Mol Biol. 1990;213(2):215-218. doi:10.1016/S0022-2836(05)80181-0 and RCSB PDB [PubMed]
Piskin E, Cianciosi D, Gulec S, Tomas M, Capanoglu E. Iron Absorption: Factors, Limitations, and Improvement Methods. ACS Omega. 2022 Jun 21; 7(24): 20441–20456. doi: 10.1021/acsomega.2c01833 [PMC]
Benkhedda K.; L’abbé M. R.; Cockell K. A. Effect of Calcium on Iron Absorption in Women with Marginal Iron Status. Br. J. Nutr. 2010, 103 (5), 742–748. 10.1017/S0007114509992418. [PubMed] [Cambridge Core]
Ziegler E.E. Consumption of cow’s milk as a cause of iron deficiency in infants and toddlers. Nutr. Rev. 2011;69:37–42. doi: 10.1111/j.1753-4887.2011.00431.x. [PubMed] [Oxford Academic]
Cory H, Passarelli S, Szeto J, Tamez M, Mattei J. The Role of Polyphenols in Human Health and Food Systems: A Mini-Review. Front Nutr. 2018;5:87. Published 2018 Sep 21. doi:10.3389/fnut.2018.00087 [PubMed]
Zhang H, Tsao R. Dietary polyphenols, oxidative stress and antioxidant and anti-inflammatory effects. Curr Opin Food Sci. (2016) 8:33–42. 10.1016/j.cofs.2016.02.002 [CrossRef] [Google Scholar]
Consoli A, Nurjhan N, Capani F, Gerich J. Predominant role of gluconeogenesis in increased hepatic glucose production in NIDDM. Diabetes. 1989;38:550–557. [PubMed] [Google Scholar]
Magnusson I, Rothman DL, Katz LD, Shulman RG, Shulman GI. Increased rate of gluconeogenesis in type II diabetes mellitus. A 13C nuclear magnetic resonance study. J Clin Invest. 1992;90:1323–1327. [PMC free article] [PubMed] [Google Scholar]
Meyer C, Stumvoll M, Nadkarni V, Dostou J, Mitrakou A, Gerich J. Abnormal renal and hepatic glucose metabolism in type 2 diabetes mellitus. J Clin Invest. 1998;102:619–624. [PMC free article] [PubMed] [Google Scholar]
Pan WH, Wu HJ, Yeh CJ, et al. Diet and health trends in Taiwan: comparison of two nutrition and health surveys from 1993-1996 and 2005-2008. Asia Pac J Clin Nutr. 2011;20(2):238-250. [PubMed] [Full Text]
Verhoef P, van Vliet T, Olthof MR, Katan MB. A high-protein diet increases postprandial but not fasting plasma total homocysteine concentrations: a dietary controlled, crossover trial in healthy volunteers. Am J Clin Nutr. 2005;82(3):553-558. doi:10.1093/ajcn.82.3.553 [PubMed] [Elsevier]
Kim H., Shin C., Baik I. Associations between lifestyle factors and iron overload in Korean adults. Clin. Nutr. Res. 2016;5:270–278. doi: 10.7762/cnr.2016.5.4.270. [CNR]
Lewis RA, Austen KF, Soberman RJ. Leukotrienes and other products of the 5-lipoxygenase pathway. Biochemistry and relation to pathobiology in human diseases. N Engl J Med. 1990;323(10):645-655. doi:10.1056/NEJM199009063231006 [PubMed] [NEJM]
Al-Adwi, M. E., Al-Haswsa, Z. M., Alhmmadi, K. M., Eissa, Y. A., Hamdan, A., Bawadi, H., & Tayyem, R. F. (2023). Effects of different diets on glycemic control among patients with type 2 diabetes: A literature review. Nutrition and health, 29(2), 215–221. https://doi.org/10.1177/02601060221112805 [PubMed] [Sage Journal]
Kennedy M. How much water you’re actually supposed to drink each day – and why 8 cups isn’t right for everyone. Business Insider. December 14, 2021. [Website]
Pan, B., Ge, L., Xun, Y. Q., Chen, Y. J., Gao, C. Y., Han, X., Zuo, L. Q., Shan, H. Q., Yang, K. H., Ding, G. W., & Tian, J. H. (2018). Exercise training modalities in patients with type 2 diabetes mellitus: a systematic review and network meta-analysis. The international journal of behavioral nutrition and physical activity, 15(1), 72. https://doi.org/10.1186/s12966-018-0703-3 [PubMed] [BMC]
Siddiqui NI, Nessa A, Hossain MA. Regular physical exercise: way to healthy life. Mymensingh Med J. 2010;19(1):154-158. [PubMed]
Gupta R, Vaqar S. National Guidelines for Physical Activity. [Updated 2023 Aug 17]. In: StatPearls [Internet]. Treasure Island (FL): StatPearls Publishing; 2024 Jan-. Available from: https://www.ncbi.nlm.nih.gov/books/NBK585062/ [PubMed]
Buresh R. (2014). Exercise and glucose control. The Journal of sports medicine and physical fitness, 54(4), 373–382. [PubMed] [Edizioni Minerva Medica]
van de Wiel A. Diabetes mellitus and alcohol. Diabetes Metab Res Rev. 2004;20(4):263-267. doi:10.1002/dmrr.492 [PubMed] [Wiley]
Miyagi S, Takamura T, Nguyen TTT, et al. Moderate alcohol consumption is associated with impaired insulin secretion and fasting glucose in non-obese non-diabetic men. J Diabetes Investig. 2021;12(5):869-876. doi:10.1111/jdi.13402 [PubMed]
Steiner JL, Crowell KT, Lang CH. Impact of Alcohol on Glycemic Control and Insulin Action. Biomolecules. 2015;5(4):2223-2246. Published 2015 Sep 29. doi:10.3390/biom5042223 [PubMed]
Vlassopoulos A, Lean ME, Combet E. Influence of smoking and diet on glycated haemoglobin and ‘pre-diabetes’ categorisation: a cross-sectional analysis. BMC Public Health. 2013;13:1013. Published 2013 Oct 26. doi:10.1186/1471-2458-13-1013 [PubMed]
Rohm TV, Meier DT, Olefsky JM, Donath MY. Inflammation in obesity, diabetes, and related disorders. Immunity. 2022;55(1):31-55. doi:https://doi.org/10.1016/j.immuni.2021.12.013 [Elsevier]
Knutson KL. Impact of sleep and sleep loss on glucose homeostasis and appetite regulation. Sleep Med Clin. 2007;2(2):187-197. doi:10.1016/j.jsmc.2007.03.004 [PubMed]
Liu X, Song Q, Hu W, et al. Night Sleep Duration and Risk of Incident Anemia in a Chinese Population: A Prospective Cohort Study. Sci Rep. 2018;8(1):3975. Published 2018 Mar 5. doi:10.1038/s41598-018-22407-5 [PubMed] [Nature Portfolio] [PMC Full Text]
Hirshkowitz M, Whiton K, Albert SM, et al. National Sleep Foundation’s sleep time duration recommendations: methodology and results summary. Sleep Health. 2015;1(1):40-43. doi:10.1016/j.sleh.2014.12.010 [PubMed] [Elsevier]
Hamasaki H. The Effects of Mindfulness on Glycemic Control in People with Diabetes: An Overview of Systematic Reviews and Meta-Analyses. Medicines (Basel). 2023;10(9):53. Published 2023 Sep 7. doi:10.3390/medicines10090053 [PubMed]
Pascoe MC, Thompson DR, Jenkins ZM, Ski CF. Mindfulness mediates the physiological markers of stress: Systematic review and meta-analysis. J Psychiatr Res. 2017;95:156-178. doi:10.1016/j.jpsychires.2017.08.004 [PubMed] [Elsevier]
Ganesan K, Habboush Y, Dagogo-Jack S. Calorie Restriction and Intermittent Fasting: Impact on Glycemic Control in People With Diabetes. Diabetes Spectr. 2020;33(2):143-148. doi:10.2337/ds19-0064 [PubMed]
Froy, O., Chapnik, N., & Miskin, R. (2009). Effect of intermittent fasting on circadian rhythms in mice depends on feeding time. Mechanisms of Ageing and Development, 130(3), 154–160. https://doi.org/10.1016/j.mad.2008.10.006 [NIH]
De Cabo, R., & Mattson, M. P. (2019). Effects of intermittent fasting on health, aging, and disease. New England Journal of Medicine, 381(26), 2541–2551. https://doi.org/10.1056/nejmra1905136 [NEJM]
Rochon J, Bales CW, Ravussin E, et al. Design and conduct of the CALERIE study: comprehensive assessment of the long term effects of reducing intake of energy. J Gerontol A Biol Sci Med Sci 2011;66:97-108. [PubMed] [PMC]
Most J, Gilmore LA, Smith SR, Han H, Ravussin E, Redman LM. Significant improvement in cardiometabolic health in healthy nonobese individuals during caloric restriction-induced weight loss and weight loss maintenance. Am J Physiol Endocrinol Metab 2018;314:E396-E405. [PubMed] [APS] [PMC]
Martin CK, Bhapkar M, Pittas AG, et al. Effect of calorie restriction on mood, quality of life, sleep, and sexual function in healthy nonobese adults: the CALERIE 2 randomized clinical trial. JAMA Intern Med 2016;176:743-52. [PubMed] [JAMA] [PMC]
Heilbronn LK, de Jonge L, Frisard MI, et al. Effect of 6-month calorie restriction on biomarkers of longevity, metabolic adaptation, and oxidative stress in overweight individuals: a randomized controlled trial. JAMA 2006;295:1539-48. [PubMed] [JAMA] [PMC]
Ravussin E, Redman LM, Rochon J, et al. A 2-year randomized controlled trial of human caloric restriction: feasibility and effects on predictors of health span and longevity. J Gerontol A Biol Sci Med Sci 2015;70:1097-104. [PubMed] [Oxford Academic] [PMC]
Wiernsperger, N. F., & Bailey, C. J. (1999). The antihyperglycaemic effect of metformin: therapeutic and cellular mechanisms. Drugs, 58 Suppl 1, 31–82. https://doi.org/10.2165/00003495-199958001-00009 [PubMed] [Springer]
Herman, R., Kravos, N. A., Jensterle, M., Janež, A., & Dolžan, V. (2022). Metformin and Insulin Resistance: A Review of the Underlying Mechanisms behind Changes in GLUT4-Mediated Glucose Transport. International journal of molecular sciences, 23(3), 1264. https://doi.org/10.3390/ijms23031264 [PubMed]
Schaumleffel C. (2021). Pharmacology Update: Emergency Medications for Hypoglycemia in Diabetes. NASN school nurse (Print), 36(3), 149–154. https://doi.org/10.1177/1942602X20981643 [PubMed] [Sage Journals]
Bal CS, Kumar A, Pandey RM. A randomized controlled trial to evaluate the adjuvant effect of lithium on radioiodine treatment of hyperthyroidism. Thyroid. 2002;12(5):399-405. doi:10.1089/105072502760043486 [PubMed] [Full Text]
Bauer M, Blumentritt H, Finke R, et al. Using ultrasonography to determine thyroid size and prevalence of goiter in lithium-treated patients with affective disorders. J Affect Disord. 2007;104(1-3):45-51. doi:10.1016/j.jad.2007.01.033 [PubMed] [Elsevier]
Benvenga S, Lapa D, Cannavò S, Trimarchi F. Successive thyroid storms treated with L-carnitine and low doses of methimazole. Am J Med. 2003;115(5):417-418. doi:10.1016/s0002-9343(03)00399-1[PubMed] [Elsevier]
Benvenga S. When thyroid hormone replacement is ineffective?. Curr Opin Endocrinol Diabetes Obes. 2013;20(5):467-477. doi:10.1097/MED.0000000000000003 [PubMed] [Full Text]
Amico JA, Richardson V, Alpert B, Klein I. Clinical and chemical assessment of thyroid function during therapy with amiodarone. Arch Intern Med. 1984;144(3):487-490. [PubMed] [JAMA]
V. Panneelsa, J. Van Sande, Van, et al. Inhibition of human thyroid adenylyl cyclase by 2-iodoaldehydes. Molecular and cellular endocrinology. 1994;106(1-2):41-50. [PubMed][Elsevier]
Khan ZA, Khan T, Bhardwaj A, Aziz SJ, Sharma S. Underweight as a Risk Factor for Nutritional Anaemia – A Cross-sectional Study among Undergraduate Students of a Medical College of Haryana. Indian Journal of Community Health. 2018;30(1):63-69. [IJCH]
Jackowska M, Kumari M, Steptoe A. Sleep and biomarkers in the English Longitudinal Study of Ageing: associations with C-reactive protein, fibrinogen, dehydroepiandrosterone sulfate and hemoglobin. Psychoneuroendocrinology. 2013;38(9):1484-1493. doi:10.1016/j.psyneuen.2012.12.015 [PubMed] [Elsevier]