Hemoglobin and Hematocrit: Diagnostic Significance and Clinical Insights
Authors: Payal Bhandari M.D., Hailey Chin, Madison Granados
Contributors: Vivi Chador, Amer Džanković, Emilia Feria, Nigella Umali Ruguian
Key Insights
Blood contains red blood cells (RBCs), white blood cells (WBCs), and platelets. RBCs transport oxygen via hemoglobin, WBCs defend against infections and maintain immune balance, and platelets prevent blood loss by forming clots and aiding tissue repair .
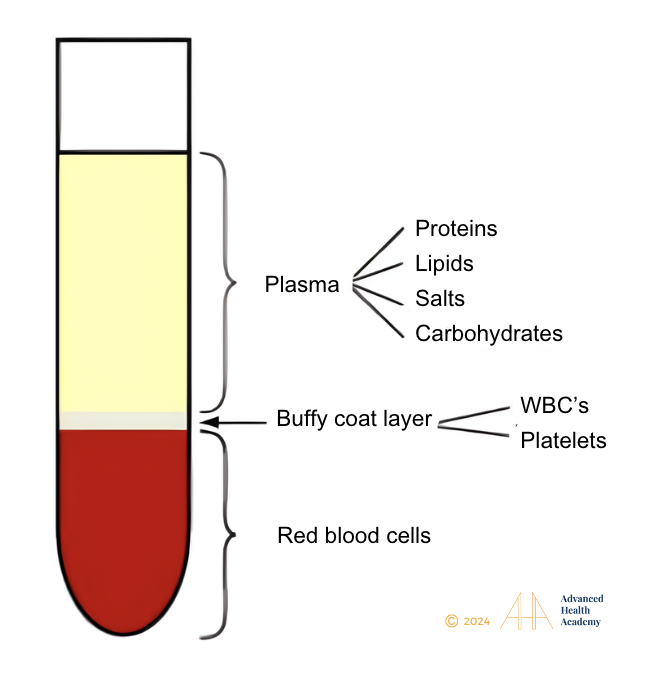
Figure 1: Blood is divided into three parts: 55% is plasma, which comprises of water (93%), salts, proteins, lipids, and glucose; 45% are red blood cells; and 1% are WBCs and platelets.
What are the Hemoglobin and Hematocrit Blood Tests?
Hemoglobin
The Hgb test measures the amount of hemoglobin in RBCs and helps estimate how much oxygen is reaching the body’s tissues. Hgb is a protein found only in RBCs, making up 96-97% of their dry weight and giving blood its bright red color. The most common type of hemoglobin is Hgb A. Figure 2 illustrates the makeup of an element of Hemoglobin.
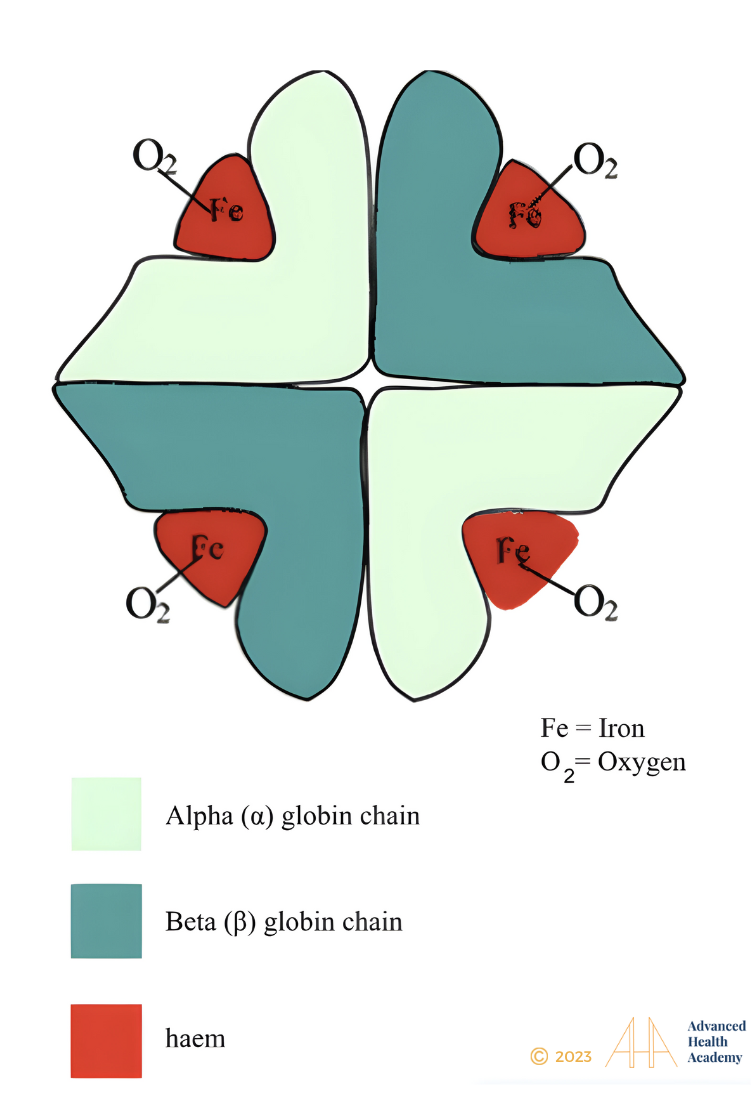
Figure 2: Hemoglobin structure.
Hemoglobin (Hgb) consists of two alpha and two beta globin chains, each with a heme group containing an iron atom (Fe²⁺). With help from vitamins B12 and B9 (folate), oxygen binds to the iron, forming oxyhemoglobin. Each Hgb molecule can carry up to four oxygen molecules. Vitamin B9 and B12 are regulated by the stomach, while iron is absorbed in the small intestine.
Hematocrit
The Hematocrit test, also known as a packed cell volume (PCV) test, measures the total amount of RBCs in the blood sample and provides vital information about the transport of oxygen in relation to the whole blood volume. This test involves collecting a blood sample and centrifuging it to separate its components. The heavier red blood cells (RBCs) settle at the bottom, while the lighter plasma rises to the top. The hematocrit percentage is determined by comparing the volume of RBCs to the total blood sample4. Measuring Hct helps identify polycythemia (high RBC) and anemia (low RBC) to aid in disease detection, guiding treatment, and management.
Role of Hemoglobin
RBCs transport O₂ from the lungs to tissues and remove CO₂ during exhalation. Hgb carries most of the oxygen, as only a small amount dissolves in plasma. RBCs use O₂, H, and CO₂ for energy production through cellular respiration.
As RBCs develop in the bone marrow, they produce their own Hgb. RBCs lack a nucleus or mitochondria, creating more space for Hgb and preventing oxygen from being delivered to tissues. Once in the bloodstream, the Hgb content of RBCs remains constant throughout their lifespan.
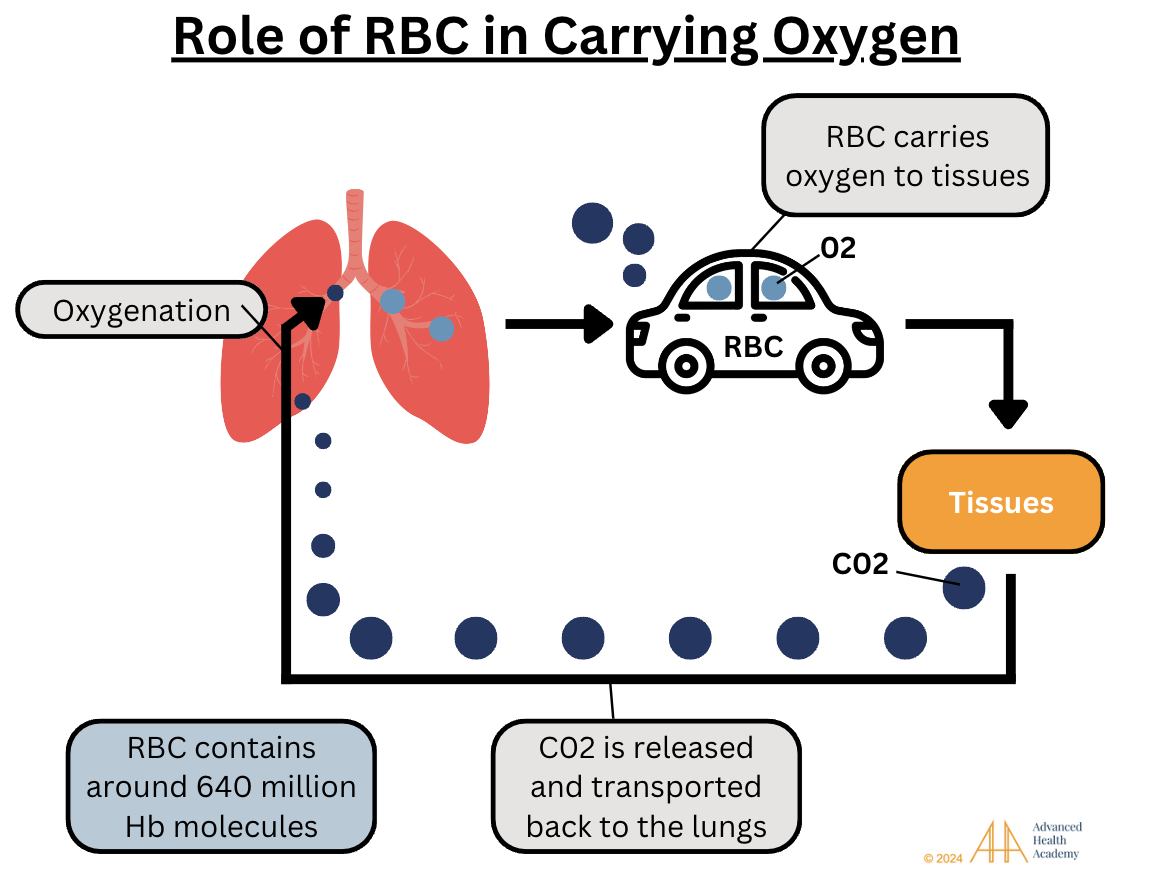
Figure 3: RBCs main job is to carry O2 to tissue and release the waste product, CO2 during exhalation. RBCs contain around 640 million Hgb molecules per cell.
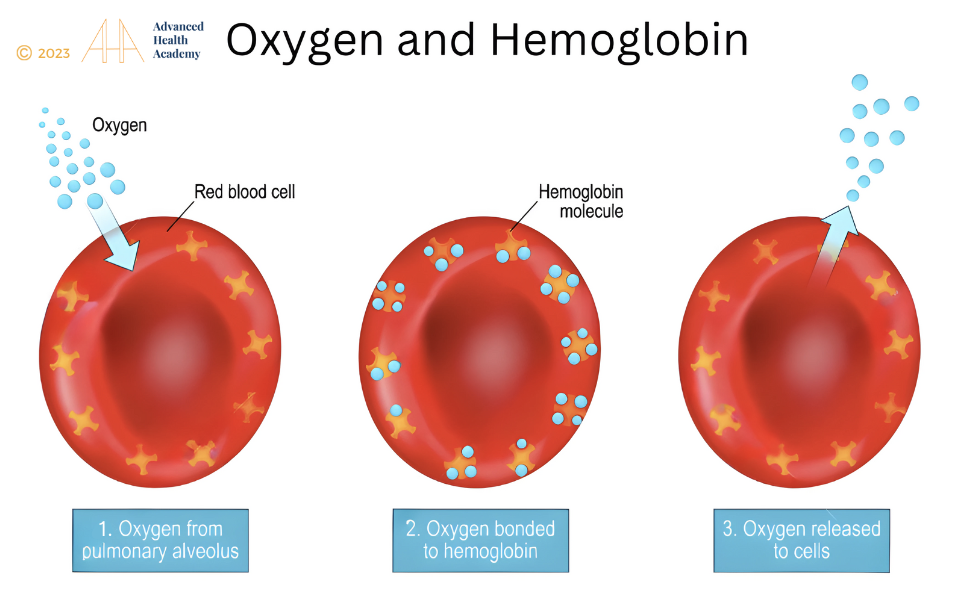
Figure 4: 98% to 99% of oxygen in the blood binds to Hgb in red blood cells and is transported to tissue throughout the body.
Regulation of Hemoglobin and Hematocrit
The production of Hgb and RBCs is regulated by the body’s ability to produce energy (ATP) through cellular respiration.
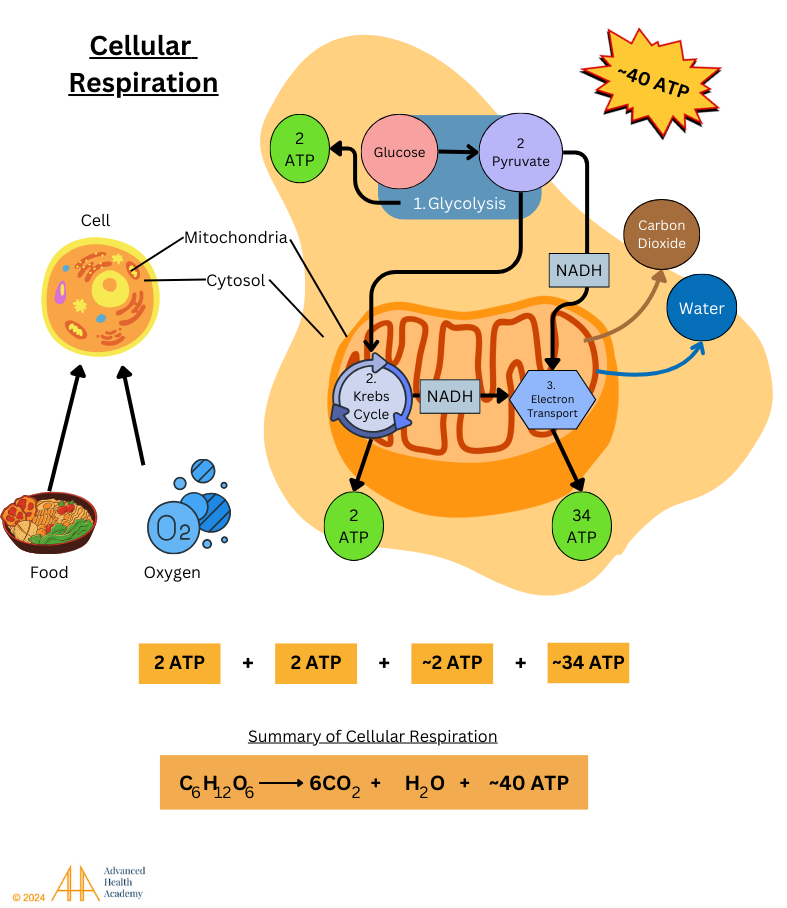
Figure 5: Cellular respiration is a series of chemical reactions that convert energy from food (originally from plants through photosynthesis) into high-energy molecules like ATP (adenosine triphosphate), NADH, and FADH. These reactions also produce carbon dioxide (CO₂) as a waste product, which is exhaled by the lungs. This process happens in three main stages: glycolysis, the Krebs cycle, and the electron transport chain, with most energy (34 ATP) being made in the mitochondria during the electron transport chain.
The body typically produces ATP from glucose through glycolysis. In low-energy states like fasting, intense exercise, or diabetes, it uses ketogenesis, breaking down stored fats and proteins into amino acids, lactic acid, and glycerol. Since the brain cannot use fat directly, glycerol is converted into glucose to meet its energy needs.
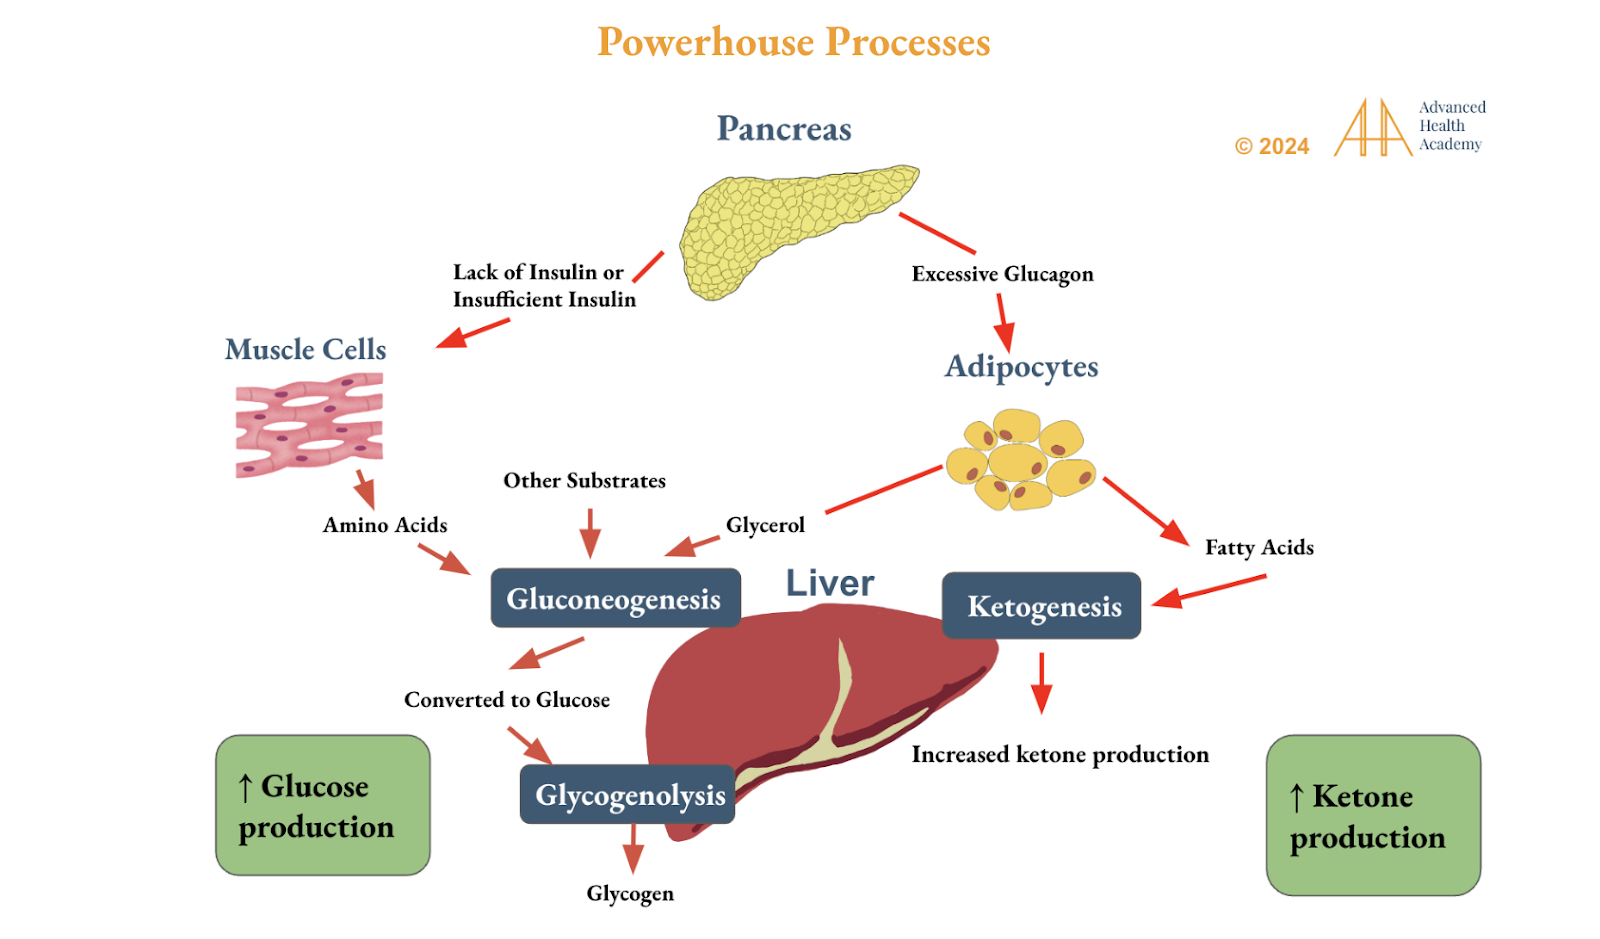
Figure 6: Circadian rhythm (sleep-wake cycle) genes control the production of glucose and ketones in the liver to create energy (ATP). This is done by breaking down fatty acids, amino acids, glycerol, and other materials in fat cells (adipocytes), the liver, and skeletal muscles. Ketones provide energy during fasting, intense exercise, low insulin, or high brain energy demands. Ketogenesis produces more ATP (34) than glucose (2-4), stabilizing blood sugar, improving insulin sensitivity, and reducing carb dependence. It can lower hunger, stabilize mood, reduce hormonal imbalances, and decrease inflammation from oxidative stress.
The attachment of sugar molecules to the beta chains of Hgb affects its stability and its ability to deliver oxygen efficiently to tissues 11-12 . When more glucose and other sugars attach to Hgb, it reduces the ability of RBCs to carry oxygen. This lowers energy production and increases levels of harmful molecules called reactive oxygen species (ROS). This condition, known as hypoxia, allows ROS to damage RBC membranes (hemolysis), releasing free Hgb into the bloodstream and leading to higher Hgb levels on a blood test 7.
When hypoxia causes RBC damage (hemolysis), the kidneys respond by producing the hormone erythropoietin (EPO). EPO signals the bone marrow to create more RBCs and Hgb, leading to higher Hct levels in the blood.
However, if hypoxia-induced hemolysis continues untreated, the reactive oxygen species (ROS) can damage the kidneys. This damage lowers EPO production, reducing RBC and Hb production in the bone marrow. As a result, both Hct and Hgb levels decrease over time.
Clinical Significance of Low Hemoglobin and Hematocrit Levels
Low hemoglobin (Hgb) and hematocrit (Hct) levels, known as anemia, can result from reduced RBC production in the bone marrow (true anemia) or increased plasma volume, which dilutes RBC concentration (relative anemia).
Dehydration thickens the blood, reducing oxygen delivery and energy production while damaging cells . Dehydration thickens the blood, reducing oxygen delivery and energy production while damaging cells. Water loss causes RBCs to shrink, impairing oxygen transport and leading to hypoxia. The brain detects this and triggers thirst and the release of vasopressin to conserve water. Despite these efforts, dehydration harms RBCs and disrupts energy production. Severe drops in blood oxygen levels suppress the liver enzyme ALA synthase, slowing heme production, a vital component of Hgb. This reduces Hgb and Hct levels, further impairing oxygen transport .
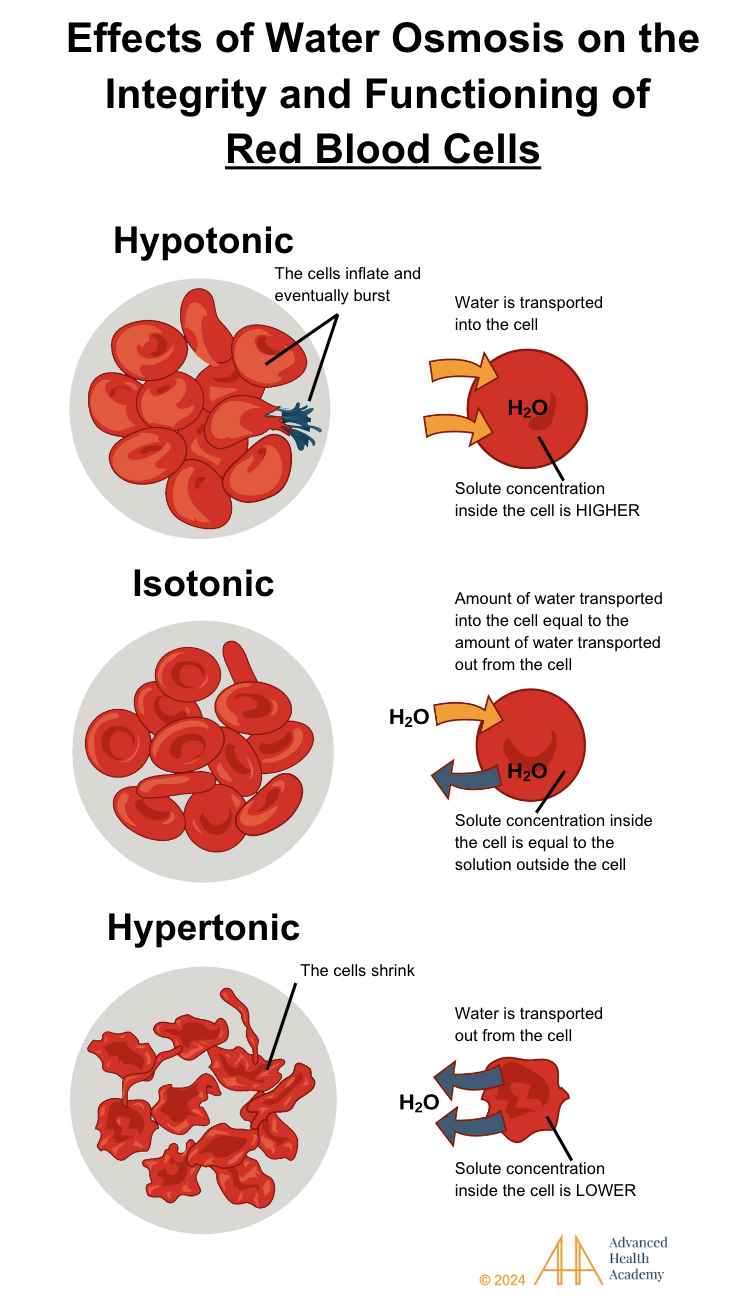
Figure 7: Effects of water osmosis on the integrity and function of blood cells. Osmosis moves water across cell membranes based on solute concentration. In a hypotonic solution, water flows into the cell. In an isotonic solution, water moves in and out equally. In a hypertonic solution, water leaves the cell.
Dehydration temporarily raising the Hb and Hct levels can occur due to the following mechanisms24:
burns
diarrhea
excessive use of diuretics or laxatives
sweating from strenuous exercise or heat stroke
inadequate water intake
inadequate breast milk consumption in newborns
excess blood loss due to:
heavy menstrual cycle
excess tissue injury associated with chronic inflammation (e.g., inflammatory bowel disease, ulcerative colitis, stomach ulcers, celiac disease, cancer), surgery, or trauma
excess blood donation, such as in blood draws
Anemia of chronic inflammation (ACI) is associated with decreased Hgb and RBC production. This often happens because chronic dehydration interferes with food digestion, nutrient absorption, and the removal of cellular waste. The resulting anemia triggers a chain of reactions in the body:
Excess undigested food particles like proteins, glucose, and fats, along with toxins in the bloodstream, thicken the blood, reducing oxygen delivery to tissues.
Cells die prematurely.
White blood cells, platelets, and smooth muscle cells repair wounds and form new blood vessels through angiogenesis. This trauma response, called atherosclerosis, produces reactive oxygen species (ROS) and inflammatory proteins, reducing arterial blood flow, raising blood pressure, and causing blood to back up into organs, leading to enlargement and dysfunction.
Chronic inflammation disrupts immune function, redirecting nutrients from fighting infections to tissue repair. White blood cells may produce antibodies that attack the body, causing autoimmune disorders. Dormant pathogens can activate, leading to infections and cancer growth.
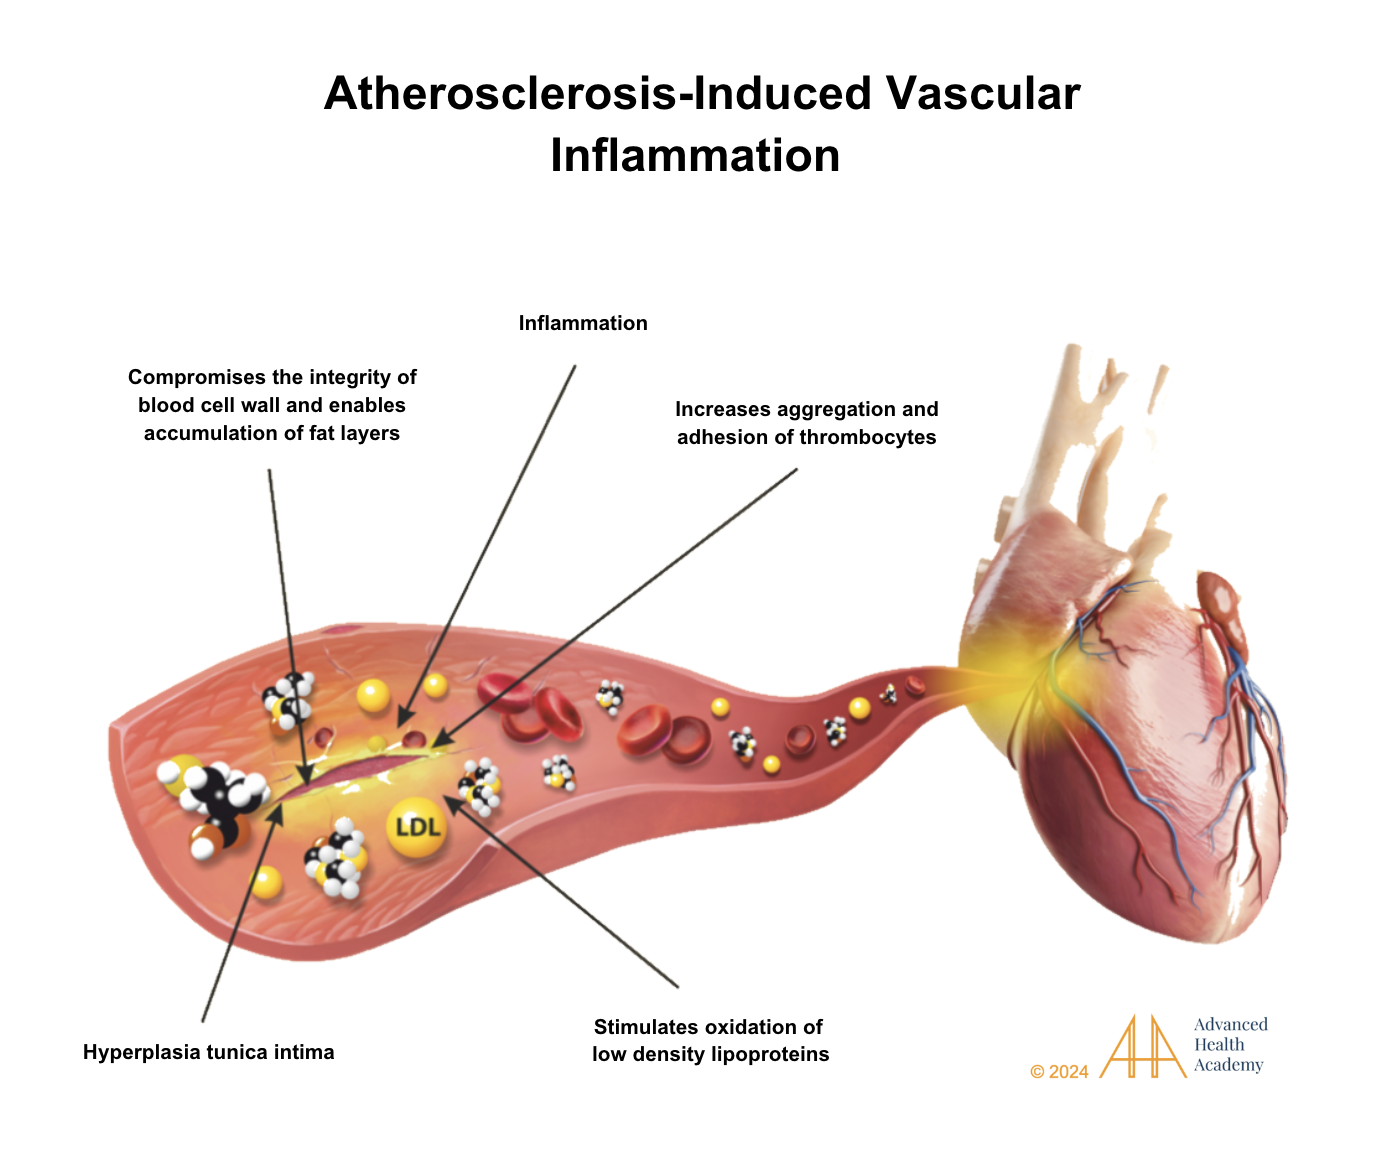
Figure 8: Atherosclerosis causes artery walls to thicken as fat, plaque, and oxidized LDL cholesterol build up, with platelets forming clots.
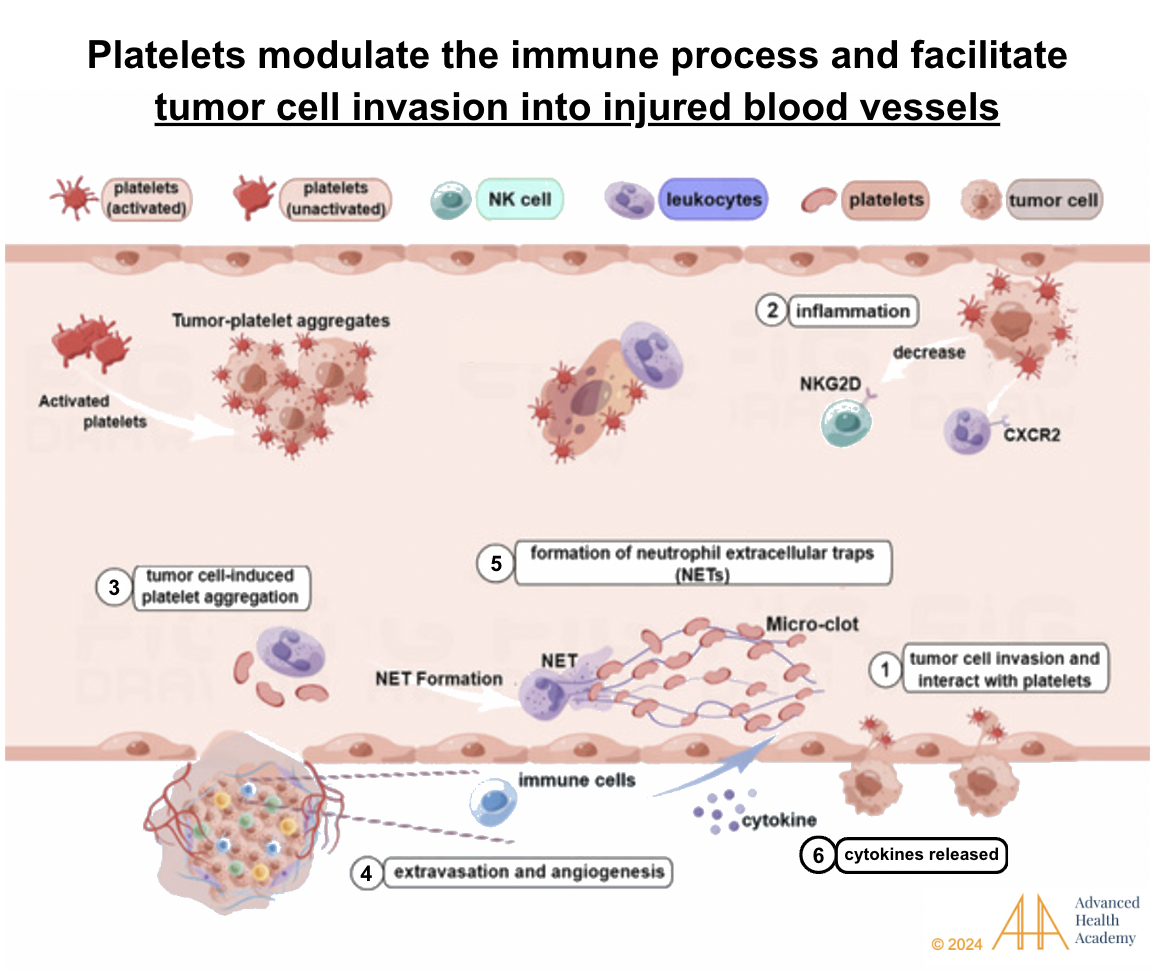
Figure 9: Anemia of chronic inflammation increases the activity of white blood cells (leukocytes) and platelets (thrombocytes), which collaborate with pathogens and tumor cells to prevent excessive bleeding and aid in wound repair. Platelets recruit tumor cells and pathogens to absorb free hemin and iron, helping them grow and spread. Neutrophils help stabilize blood vessel integrity by releasing proinflammatory proteins,27 activating platelets through tumor cells, and promoting new blood vessel formation (angiogenesis). At the same time, natural killer (NK) cells are blocked from destroying tumor cells and pathogens. This allows pathogens to release toxins that damage red blood cells, steal nutrients like iron and oxygen from organs, and contribute to infections and tumor growth.
Clinical Significance of High Hemoglobin and Hematocrit Levels
High Hgb and Hct levels indicate polycythemia. True polycythemia occurs when the bone marrow overproduces RBCs, while relative polycythemia results from decreased plasma volume, often due to dehydration, temporarily raising Hct levels.
Thicker blood in polycythemia reduces oxygen delivery (hypoxia) and shortens RBC lifespans (hemolysis). RBC breakdown releases toxic byproducts like free Hgb and iron, triggering inflammation. White blood cells remove toxins, while platelets and smooth muscle cells repair tissues. Low oxygen levels cause the kidneys to release hormones like EPO, stimulating the bone marrow to produce more RBCs, platelets, and WBCs, increasing Hct levels .
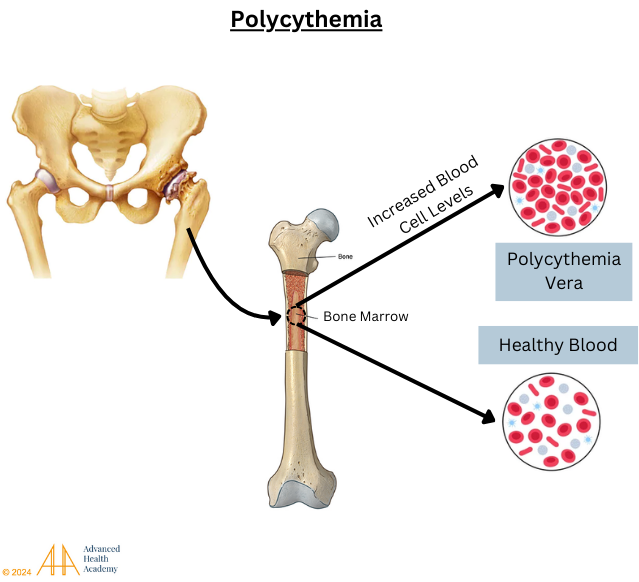
Figure 10: Polycythemia (excess red blood cell production by the bone marrow)
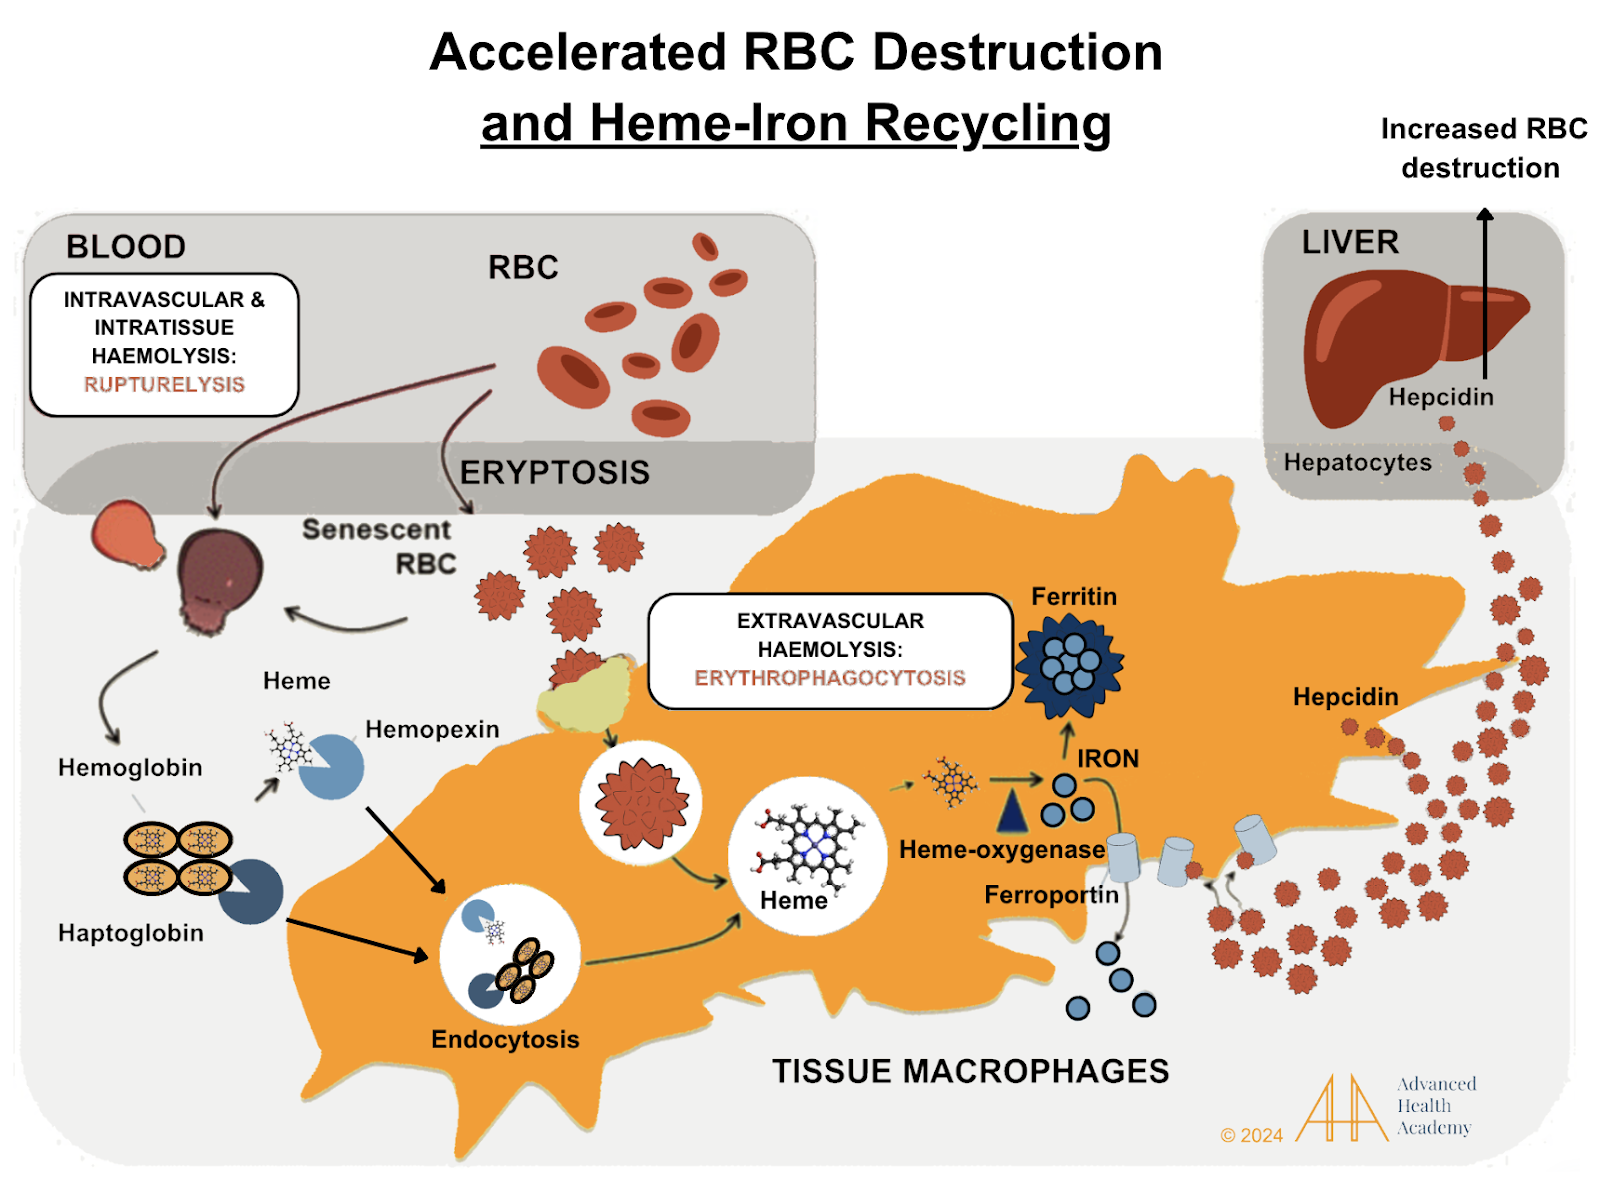
Figure 11: RBC destruction, or hemolysis, involves quickly removing toxic byproducts like free Hgb and iron from the bloodstream and transporting them to the liver. Transporter proteins like haptoglobin and hemopexin bind to hemoglobin and heme, allowing macrophages in the liver and spleen to engulf them33. Heme is broken down by heme oxygenase, releasing iron, which is stored in ferritin or transported by ferroportin to organs like the pancreas, bone marrow, and muscles . Heme is converted to bilirubin in the liver and excreted in bile, stool, or urine. The liver recycles globulin for protein production. Hemolysis increases hepcidin and ferritin levels, which block ferroportin, limiting iron release and absorption. Excess iron storage can cause hemochromatosis, while reduced oxygen levels can oxidize LDL cholesterol, contributing to atherosclerosis .
Platelets are vital for wound repair and preventing bleeding. Despite chronic hemolysis reducing RBC and platelet production, platelets form when blood flow shears parts of megakaryocytes (MKs) in the bone marrow. In chronic inflammation, MKs escape the bone marrow, travel to low-oxygen areas in the lungs, and form active platelets, which clot RBCs and aid vessel repair. To manage this, the lungs produce thrombopoietin (TPO) to destroy circulating MKs, reducing platelets and increasing RBC breakdown.
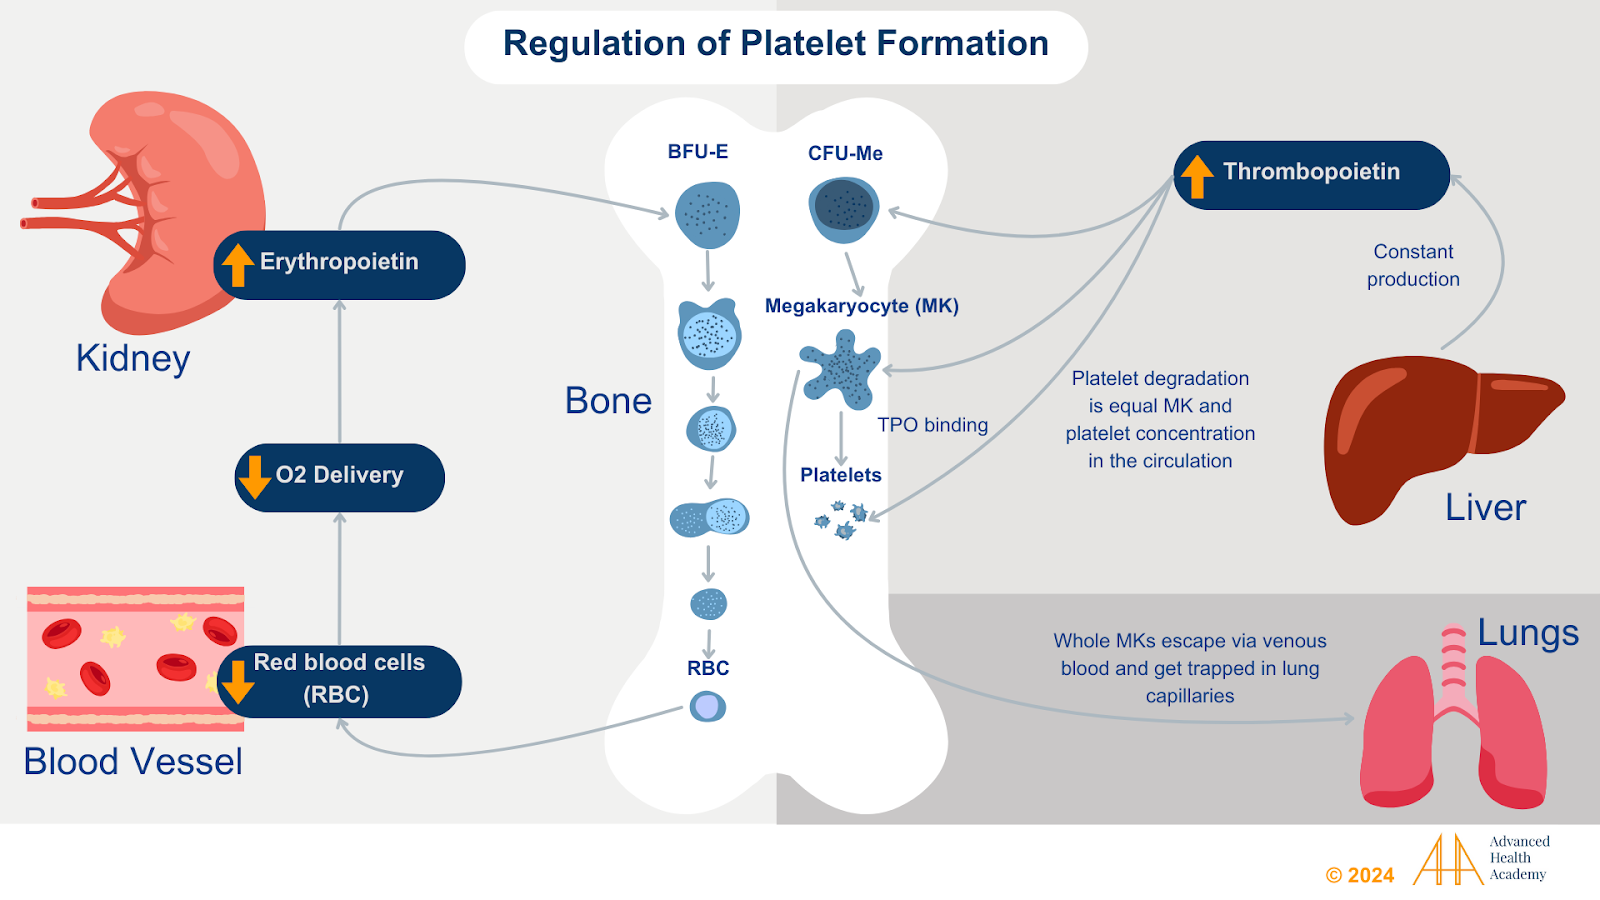
Figure 12: Hypoxia-induced red blood cell (RBC) destruction triggers the liver and kidneys to produce hormones that boost RBC and platelet production in the bone marrow. However, if the underlying cause of the destruction isn’t resolved, ongoing tissue damage in various organs leads to increased RBC and platelet breakdown.The kidneys produce erythropoietin (EPO), while the liver produces thrombopoietin (TPO) and colony-forming unit (CFU-meg). These hormones stimulate the production of red blood cells (RBCs) and megakaryocytes (MKs), respectively.. Anemia of chronic inflammation damages kidney and liver cells, reducing the hormones needed to make RBCs and platelets. Sometimes, whole megakaryocytes (MKs) escape the bone marrow and settle in the lungs, where low oxygen levels keep them from turning into platelets. During high-stress times, when oxygen levels in the lungs rise, these MKs are activated and converted into platelets . To prevent excessive tissue damage, the lungs produce thrombopoietin (TPO) and CFU-meg, which bind to and destroy circulating megakaryocytes (MKs), reducing platelet production in the bone marrow.
Prevalence and Statistics on Abnormal Hemoglobin and Hematocrit Levels
High levels of hemoglobin (Hgb) and hematocrit (Hct) indicate polycythemia, a condition affecting 44 to 57 per 100,000 people in the U.S., mostly those over 60. Younger individuals have a much lower risk. Polycythemia can be primary (polycythemia vera, PV) or secondary, often due to chronic hypoxia. Most PV cases involve a JAK2 gene mutation (JAK2V617F), which increases red blood cell and platelet production.
Low levels of Hgb and Hct cause anemia, affecting one-third of the global population. Acute anemia is often due to blood loss or rapid RBC destruction, while chronic anemia is more common and can signal other health issues. Iron deficiency anemia, the most prevalent type, accounts for 50% of cases and results from blood loss, poor iron intake, absorption issues, or gastrointestinal bleeding.
Conclusion
Hct and Hgb levels are important for understanding overall health and are used to diagnose and manage many medical conditions. Hct measures the percentage of blood made up of RBCs, while Hgb shows how well these cells can carry oxygen. High Hct or Hgb levels may point to conditions like polycythemia vera or chronic lung and heart disease, while low levels can indicate anemia caused by chronic inflammation, low plasma volume, or problems with the bone marrow, kidneys, liver, spleen, or small intestine.
Source References and Supplemental Research:
Adamson JW, Finch CA. Hemoglobin function, oxygen affinity, and erythropoietin. Annu Rev Physiol. 1975;37:351-369. doi:10.1146/annurev.ph.37.030175.002031 [PubMed] [Full Text Article]
Young B, Lowe jo, Stevens A, Heath JW (2006). Wheater’s Functional Histology (5th ed.). Elsevier Limited. [Wikipedia].
medtextfree. CHAPTER 28 STRUCTURE AND FUNCTION OF HEMOGLOBIN. Free Medical Textbook. Published December 26, 2011. [Free Medical Textbook]
Mondal, H., & Lotfollahzadeh, S. (2023). Hematocrit. In StatPearls. StatPearls Publishing. [PubMed] [StatPearls]
Billett H. Chapter 151 Hemoglobin and Hematocrit. Clinical Methods: The History, Physical, and Laboratory Examinations. 3rd edition. Boston: Butterworths; 1990. [PubMed]
Hoffbrand AV, Pettit JE. Essential Haematology. 3rd edition. Oxford: Blackwell, 1993: 24-25. [e-book]
Ogun, A. S., Joy, N. V., & Valentine, M. (2023, May 1). Biochemistry, Heme Synthesis. StatPearls – NCBI Bookshelf. https://www.ncbi.nlm.nih.gov/books/NBK537329/ [PubMed]
Layer, G., Reichelt, J., Jahn, D., & Heinz, D. W. (2010). Structure and function of enzymes in heme biosynthesis. Protein science : a publication of the Protein Society, 19(6), 1137–1161. https://doi.org/10.1002/pro.405 [PubMed]
MedlinePlus. (n.d.). Globulin test. [Medline]
National Library of Medicine (US). (n.d.). Globulins [MeSH Terms] [PubMed]
Raczuk E, Dmochowska B, Samaszko-Fiertek J, Madaj J. Different Schiff Bases-Structure, Importance and Classification. Molecules. 2022;27(3):787. Published 2022 Jan 25. doi:10.3390/molecules27030787 [PubMed]
Rahbar S. The discovery of glycated hemoglobin: a major event in the study of nonenzymatic chemistry in biological systems. Ann N Y Acad Sci. 2005;1043:9-19. doi:10.1196/annals.1333.002 [PubMed] [Wiley]
The Amadori Rearrangement. (1955). ScienceDirect. https://doi.org/10.1016/S0096-5332(08)60392-6 [Elsevier]
Hemoglobin Synthesis. sickle.bwh.harvard.edu. Published April 14, 2002. [Harvard Medical School]
Adamson J. Erythropoietin, iron metabolism, and red blood cell production. Semin Hematol. 1996;33(2 Suppl 2):5-9. [PubMed]
Perutz, M. F., Rossmann, M. G., Cullis, A. F., Muirhead, H., Will, G., & North, A. C. (1960). Structure of hemoglobin: a three-dimensional Fourier synthesis at 5.5-A. resolution, obtained by X-ray analysis. Nature, 185(4711), 416–422. https://doi.org/10.1038/185416a0 [PubMed] [Nature Portfolio]
White, Hayden; Venkatesh, Balasubramanian (2011). “Clinical review: Ketones and brain injury.” Critical Care. 15 (2): 219. doi:10.1186/cc10020. [PubMed] [BMC] [Full Text]
Wang J, Klein H. Red blood cell transfusion in the treatment and management of anemia: the search for the elusive transfusion trigger. Vox Sanguinis 2010; 98: 2-11 [Wiley]
McClellan S, Walsh T. Oxygen delivery and hemoglobin. Contin Educ Anaesth Crit Care Pain 2004; 4: 123-26, [Full Text]
Ezzati M., Lopez A.D., Rodgers A., Van der Hoorn S., Murray C.J., Comparative Risk Assessment Collaborating Group Selected major risk factors and global and regional burden of disease. Lancet. 2002;360:1347–1360. doi: 10.1016/S0140-6736(02)11403-6. [The Lancet]
Hom J, Dulmovits BM, Mohandas N, Blanc L. The erythroblastic island as an emerging paradigm in the anemia of inflammation. Immunol Res. 2015;63(1-3):75-89. doi:10.1007/s12026-015-8697-2 [PubMed]
Ramsay DJ. Homeostatic control of water balance. In: Arnaud MJ, editor. Hydration Throughout Life. Montrouge: John Libbey Eurotext; 1998. pp. 9–18. [Google Scholar]
Bunn HF. Hemoglobin I. Structure and function. In: Beck WS, Hematology. Cambridge, MA: MIT Press, 1981;129. [Research Gate]
Chung, J., Chen, C., & Paw, B. H. (2012). Heme metabolism and erythropoiesis. Current opinion in hematology, 19(3), 156–162. https://doi.org/10.1097/MOH.0b013e328351c48b [PubMed] [Full Text] [PubMed]
Song Y, Liu J, Zhao K, Gao L, Zhao J. Cholesterol-induced toxicity: An integrated view of the role of cholesterol in multiple diseases. Cell Metabolism. 2021;33(10):1911-1925. doi:10.1016/j.cmet.2021.09.001 [Elsevier]
Adiels M, Olofsson SO, Taskinen MR, Borén J. Overproduction of very low-density lipoproteins is the hallmark of the dyslipidemia in the metabolic syndrome. Arterioscler Thromb Vasc Biol. 2008;28(7):1225-1236. doi:10.1161/ATVBAHA.107.160192 [PubMed] [Full Text] [AHA Journals]
Setién-Suero E, Suárez-Pinilla M, Suárez-Pinilla P, Benedicto Crespo-Facorro, Ayesa-Arriola R. Homocysteine and cognition: A systematic review of 111 studies. 2016;69:280-298. doi:https://doi.org/10.1016/j.neubiorev.2016.08.014 [Elsevier]
Schaffer A, Verdoia M, Cassetti E, et al. Relationship between homocysteine and coronary artery disease. Results from a large prospective cohort study. Thromb Res. 2014;134(2):288-293. doi:10.1016/j.thromres.2014.05.025 [PubMed] [Elsevier]
Perna AF, Ingrosso D. Atherosclerosis determinants in renal disease: how much is homocysteine involved?. Nephrol Dial Transplant. 2016;31(6):860-863. doi:10.1093/ndt/gfv409 [PubMed] [Oxford Academic]
Singh A, Koritala T, Jialal I. Unconjugated Hyperbilirubinemia. [Updated 2023 Feb 20]. In: StatPearls [Internet]. Treasure Island (FL): StatPearls Publishing; 2024 Jan-. [PubMed]
Ravasi G, Pelucchi S, Greni F, et al. Circulating factors are involved in hypoxia-induced hepcidin suppression. Blood Cells Mol Dis. 2014;53(4):204-210. doi:10.1016/j.bcmd.2014.06.006 [PubMed] [Elsevier]
Nemeth E, Valore EV, Territo M, Schiller G, Lichtenstein A, Ganz T. Hepcidin, a putative mediator of anemia of inflammation, is a type II acute-phase protein. Blood. 2003;101(7):2461-2463. doi:10.1182/blood-2002-10-3235 [PubMed] [Elsevier]
Weiss G. (2009). Iron metabolism in the anemia of chronic disease. Biochimica et biophysica acta, 1790(7), 682–693. https://doi.org/10.1016/j.bbagen.2008.08.006 [PubMed] [Elsevier]
Weiss, G., & Goodnough, L. T. (2005). Anemia of chronic disease. The New England journal of medicine, 352(10), 1011–1023. https://doi.org/10.1056/NEJMra041809 [PubMed] [NEJM]
Liao YF, Zhu W, Li DP, Zhu X. Heme oxygenase-1 and gut ischemia/reperfusion injury: A short review. World J Gastroenterol. 2013;19(23):3555-3561. doi:10.3748/wjg.v19.i23.3555 [PMC Full Text] [PubMed] [Crosslink]
Fevery J, Blanckaert N, Heirwegh KP, Préaux AM, Berthelot P. Unconjugated bilirubin and an increased proportion of bilirubin monoconjugates in the bile of patients with Gilbert’s syndrome and Crigler-Najjar disease. J Clin Invest. 1977;60(5):970–979. [PMC free article] [PubMed] [Google Scholar]
Rouyez MC, Boucheron C, Gisselbrecht S, Dusanter-Fourt I, Porteu F. Control of thrombopoietin-induced megakaryocytic differentiation by the mitogen-activated protein kinase pathway. Mol Cell Biol. 1997;17:4991-5000 [PubMed] [PMC Full Text]
Ishikawa T, Ichida T, Matsuda Y, Sugitani S, Sugiyama M, Kato T, Miyazaki H, Asakura H. Reduced expression of thrombopoietin is involved in thrombocytopenia in human and rat liver cirrhosis. J Gastroenterol Hepatol. 1998;13:907-913. [PubMed] [Crosslink]
Ishikawa T, Ichida T, Sugahara S, Yamagiwa S, Matsuda Y, Uehara K, Kato T, Miyazaki H, Asakura H. Thrombopoietin receptor (c-Mpl) is constitutively expressed on platelets of patients with liver cirrhosis, and correlates with its disease progression. Hepatol Res. 2002;23:115-121. [PubMed] [Crosslink]
Rouyez MC, Boucheron C, Gisselbrecht S, Dusanter-Fourt I, Porteu F. Control of thrombopoietin-induced megakaryocytic differentiation by the mitogen-activated protein kinase pathway. Mol Cell Biol. 1997;17:4991-5000 [PubMed] [PMC Full Text]
Zhao. Platelet generation from circulating megakaryocytes is triggered in the lung vasculature. BioRXiv (2021) bioRxiv 2021.11.01.466743. doi: 10.21203/rs.3.rs-690639/v1 [BioRXiv Full Text] [Crosslink]
Gelon L, Fromont L, Lefrançais E. Occurrence and role of lung megakaryocytes in infection and inflammation. Frontiers in Immunology. 2022;13. doi:10.3389/fimmu.2022.1029223 [PubMed] [PMC Full Text] [Crosslink]
Poirault-Chassac S, Nivet-Antoine V, Houvert A, Kauskot A, Lauret E, Lai-Kuen R, et al. Mitochondrial dynamics and reactive oxygen species initiate thrombopoiesis from mature megakaryocytes. Blood Adv (2021) 5(6):1706–18. doi: 10.1182/bloodadvances.2020002847 [PubMed] [PMC Full Text] [Crosslink]
Gelon L, Fromont L, Lefrançais E. Occurrence and role of lung megakaryocytes in infection and inflammation. Frontiers in Immunology. 2022;13. doi:10.3389/fimmu.2022.1029223 [PubMed] [PMC Full Text] [Crosslink]
Reddy, S., Ramsubeik, K., Vega, K. J., Federico, J., & Palacio, C. (2010). Do HbA1C Levels Correlate With Delayed Gastric Emptying in Diabetic Patients?. Journal of neurogastroenterology and motility, 16(4), 414–417. https://doi.org/10.5056/jnm.2010.16.4.414 [JNM]
Abumrad NA, Davidson NO. Role of the gut in lipid homeostasis. Physiol Rev 2012; 92:1061-1085 [PMC free article] [PubMed]
Wilson J.G., Lindquist J.H., Grambow S.C., Crook E.D., Maher J.F. Potential role of increased iron stores in diabetes. Am. J. Med. Sci. 2003;325:332–339. doi: 10.1097/00000441-200306000-00004. [PubMed] [CrossRef] [Google Scholar]
Tiedge M., Lortz S., Drinkgern J., Lenzen S. Relation between antioxidant enzyme gene expression and antioxidative defense status of insulin-producing cells. Diabetes. 1997;46:1733–1742. doi: 10.2337/diab.46.11.1733. [PubMed] [CrossRef] [Google Scholar]
Dludla P.V., Joubert E., Muller C.J.F., Louw J., Johnson R. Hyperglycemia-induced oxidative stress and heart disease-cardioprotective effects of rooibos flavonoids and phenylpyruvic acid-2-O-beta-D-glucoside. Nutr. Metab. 2017;14:45. doi: 10.1186/s12986-017-0200-8. [PMC free article] [PubMed] [CrossRef] [Google Scholar].
Žiberna, L., Jenko-Pražnikar, Z., & Petelin, A. (2021). Serum Bilirubin Levels in Overweight and Obese Individuals: The Importance of Anti-Inflammatory and Antioxidant Responses. Antioxidants (Basel, Switzerland), 10(9), 1352. https://doi.org/10.3390/antiox10091352 [PubMed] [MDPI] [PubMed]
Chen, L., Deng, H., Cui, H., Fang, J., Zuo, Z., Deng, J., Li, Y., Wang, X., & Zhao, L. (2017). Inflammatory responses and inflammation-associated diseases in organs. Oncotarget, 9(6), 7204–7218. https://doi.org/10.18632/oncotarget.23208 [Oncotarget]
Kaushansky K, Lichtman MA, Prchal J, et al. Williams Hematology. 9th ed. New York: McGraw-Hill; 2015. [Access Medicine]
Emanuelsson, F., Nordestgaard, B. G., & Benn, M. (2018). Familial hypercholesterolemia and risk of peripheral arterial disease and chronic kidney disease. The Journal of Clinical Endocrinology & Metabolism, 103(12), 4491–4500. https://doi.org/10.1210/jc.2018-01058 [CrossRef] [Google Scholar] [Scopus]
Sayer, A. A., Dennison, E. M., Syddall, H. E., Gilbody, H. J., Phillips, D. I. W., & Cooper, C. (2005, October 1). Type 2 diabetes, muscle strength, and impaired physical function: The tip of the iceberg?. American Diabetes Association. [ADA]
The medical minute: Consider your A1C levels to monitor heart health. Penn State Health News. (2023, February 10). [Penn State Health News]
Khan L. Anemia in Childhood. Pediatric Ann. 2018;47:42–47. doi: 10.3928/19382359-20180129-01. [PubMed]
Vogelaar J.L., Loar R.W., Bram R.J., Fischer P.R., Kaushik R. Anasarca, Hypoalbuminemia and Anemia: What is the Correlation? Clin. Pediatrics. 2014;53:710–712. doi: 10.1177/0009922814526990. [PubMed]
Miniero R., Talarico V., Galati M.C., Giancotti L., Saracco P., Raiola G. Iron Deficiency Anemia. IntechOpen; London, UK: 2019. Iron Deficiency and Iron Deficiency Anemia in Children; pp. 23–38. [PubMed]
Tefferi A. Polycythemia Vera – NORD (National Organization for Rare Disorders). NORD (National Organization for Rare Disorders). Published 2015. [Rare Diseases]
Cario, H., McMullin, M. F., & Pahl, H. L. (2009). Clinical and hematological presentation of children and adolescents with polycythemia vera. Annals of hematology, 88(8), 713–719. https://doi.org/10.1007/s00277-009-0758-y [PubMed]
Polycythemia Vera (PV) – MPN Research Foundation. Mpnresearchfoundation.org. Published 2022. [MPN Research Foundation]
Verhoef P, van Vliet T, Olthof MR, Katan MB. A high-protein diet increases postprandial but not fasting plasma total homocysteine concentrations: a dietary controlled, crossover trial in healthy volunteers. Am J Clin Nutr. 2005;82(3):553-558. doi:10.1093/ajcn.82.3.553 [PubMed] [Elsevier]
Kim H., Shin C., Baik I. Associations between lifestyle factors and iron overload in Korean adults. Clin. Nutr. Res. 2016;5:270–278. doi: 10.7762/cnr.2016.5.4.270. [CNR]
Lewis RA, Austen KF, Soberman RJ. Leukotrienes and other products of the 5-lipoxygenase pathway. Biochemistry and relation to pathobiology in human diseases. N Engl J Med. 1990;323(10):645-655. doi:10.1056/NEJM199009063231006 [PubMed] [NEJM]
Boldt D. H. New Perspectives on Iron: An Introduction. Am. J. Med. Sci. 1999, 318 (4), 207. 10.1097/00000441-199910000-00001. [PubMed]
Smirnoff N. Ascorbic Acid Metabolism and Functions: A Comparison of Plants and Mammals. Free Radic. Biol. Med. 2018, 122, 116–129. 10.1016/j.freeradbiomed.2018.03.033. [PubMed]
Vanderhoof J.A., Kleinman R.E. Iron Requirements for Infants with Cow Milk Protein Allergy. J. Pediatrics. 2015;167:36–39. doi: 10.1016/j.jpeds.2015.07.019. [PubMed] [Elsevier]
Hart J. J.; Tako E.; Kochian L. V.; Glahn R. P. Identification of Black Bean (Phaseolus Vulgaris L.) Polyphenols That Inhibit and Promote Iron Uptake by Caco-2 Cells. J. Agric. Food Chem. 2015, 63 (25), 5950–5956. 10.1021/acs.jafc.5b00531. [PubMed]
Colussi, G., Catena, C., Novello, M., Bertin, N., & Sechi, L. A. (2017). Impact of omega-3 polyunsaturated fatty acids on vascular function and blood pressure: Relevance for cardiovascular outcomes. Nutrition, metabolism, and cardiovascular diseases : NMCD, 27(3), 191–200. https://doi.org/10.1016/j.numecd.2016.07.011 [PubMed] [Elsevier]
Naghedi-Baghdar, H., Nematy, M., Kooshyar, M. M., Taghipour, A., Sajadi Tabassi, S. A., Shokri, S., Javan, R., & Nazari, S. M. (2018). Effect of a functional food (vegetable soup) on blood rheology in patients with polycythemia. Avicenna journal of phytomedicine, 8(5), 389–398. [PubMed]
Watso, J. C., & Farquhar, W. B. (2019). Hydration Status and Cardiovascular Function. Nutrients, 11(8), 1866. https://doi.org/10.3390/nu11081866 [PubMed]
Kennedy M. How much water you’re actually supposed to drink each day – and why 8 cups isn’t right for everyone. Business Insider. December 14, 2021. [Website]
Ballard H. S. (1997). The hematological complications of alcoholism. Alcohol health and research world, 21(1), 42–52. [PubMed]
Bradley CS, Erickson BA, Messersmith EE, et al. Evidence of the Impact of Diet, Fluid Intake, Caffeine, Alcohol and Tobacco on Lower Urinary Tract Symptoms: A Systematic Review. J Urol. 2017;198(5):1010-1020. doi:10.1016/j.juro.2017.04.097 [PubMed] [PMC Full Text] [Full Text]
Polhuis KCMM, Wijnen AHC, Sierksma A, Calame W, Tieland M. The Diuretic Action of Weak and Strong Alcoholic Beverages in Elderly Men: A Randomized Diet-Controlled Crossover Trial. Nutrients. 2017;9(7):660. Published 2017 Jun 28. doi:10.3390/nu9070660 [PubMed]
Immanuel, S., Bororing, S. R., & Dharma, R. S. (2006). The effect of aerobic exercise on blood and plasma viscosity on cardiac health club participants. Acta medica Indonesiana, 38(4), 185–188. [PubMed] [Free Full Text PDF]
El-Sayed M. S. (1998). Effects of exercise and training on blood rheology. Sports medicine (Auckland, N.Z.), 26(5), 281–292. https://doi.org/10.2165/00007256-199826050-00001 [PubMed] [Springer]
Kilic-Toprak, E., Ardic, F., Erken, G., Unver-Kocak, F., Kucukatay, V., & Bor-Kucukatay, M. (2012). Hemorheological responses to progressive resistance exercise training in healthy young males. Medical science monitor : international medical journal of experimental and clinical research, 18(6), CR351–CR360. https://doi.org/10.12659/msm.882878 [PubMed] [ISI] [PubMed]
Benevolo, G., Vassallo, F., Urbino, I., & Giai, V. (2021). Polycythemia Vera (PV): Update on Emerging Treatment Options. Therapeutics and clinical risk management, 17, 209–221. https://doi.org/10.2147/TCRM.S213020 [PubMed]
Cleveland Clinic. Erythrocytosis (Polycythaemia): Definition, Causes & Treatment. Cleveland Clinic. Published May 7, 2022. [Cleveland Clinic]
Mayo Clinic. Polycythemia vera – Diagnosis and treatment – Mayo Clinic. Mayoclinic.org. Published 2017. [Mayo Clinic]
Lebovitz HE. Oral therapies for diabetic hyperglycemia. Endocrinol Metab Clin North Am. 2001;30(4):909-933. doi:10.1016/s0889-8529(05)70221-8 [PubMed] [Elsevier]
Scheen AJ. Pharmacokinetic and toxicological considerations for the treatment of diabetes in patients with liver disease. Expert Opin Drug Metab Toxicol. 2014;10(6):839-857. doi:10.1517/17425255.2014.902444 [PubMed] [Full Text] [ORBI]
Delcò F, Tchambaz L, Schlienger R, Drewe J, Krähenbühl S. Dose adjustment in patients with liver disease. Drug Saf. 2005;28(6):529-545. doi:10.2165/00002018-200528060-00005 [PubMed] [Springer]
Baumann H, Gauldie J. Regulation of hepatic acute phase plasma protein genes by hepatocyte stimulating factors and other mediators of inflammation. Mol Biol Med. 1990;7(2):147-159. [PubMed]
Whicher JT, Westacott CI. The acute phase response. In: Whicher JT, Evans SW, editors. Biochemistry of Inflammation. London: Kluwer Academic; 1992. pp. 243–71. [Springer]
Larrey D, Pageaux GP. Drug-induced acute liver failure. Eur J Gastroenterol Hepatol. 2005;17(2):141-143. doi:10.1097/00042737-200502000-00002 [PubMed] [Crosslink]
Fontana RJ, Hayashi PH, Gu J, et al. Idiosyncratic drug-induced liver injury is associated with substantial morbidity and mortality within 6 months from onset. Gastroenterology. 2014;147(1):96-108.e4. doi:10.1053/j.gastro.2014.03.045 [PMC Full Text] [PubMed] [Crosslink]
McGill MR, Jaeschke H. Metabolism and disposition of acetaminophen: recent advances in relation to hepatotoxicity and diagnosis. Pharm Res. 2013;30(9):2174-2187. doi:10.1007/s11095-013-1007-6 [PMC Full Text] [PubMed] [Crosslink]
McGill MR, Sharpe MR, Williams CD, Taha M, Curry SC, Jaeschke H. The mechanism underlying acetaminophen-induced hepatotoxicity in humans and mice involves mitochondrial damage and nuclear DNA fragmentation. J Clin Invest. 2012;122(4):1574-1583. doi:10.1172/JCI59755 [PMC Full Text] [PubMed] [Crosslink]
Watkins PB, Kaplowitz N, Slattery JT, et al. Aminotransferase elevations in healthy adults receiving 4 grams of acetaminophen daily: a randomized controlled trial. JAMA. 2006;296(1):87-93. doi:10.1001/jama.296.1.87 [PubMed] [Crosslink]
Yuan L, Kaplowitz N. Mechanisms of drug-induced liver injury. Clin Liver Dis. 2013;17(4):507-vii. doi:10.1016/j.cld.2013.07.002 [PMC Full Text] [PubMed] [Crosslink]
Harshad Devarbhavi, Raj S, Aradya VH, et al. Drug‐induced liver injury associated with stevens‐Johnson syndrome/toxic epidermal necrolysis: Patient characteristics, causes, and outcome in 36 cases. 2016;63(3):993-999. doi:https://doi.org/10.1002/hep.28270 [AASLD]
Kaplowitz N. Idiosyncratic drug hepatotoxicity. Nat Rev Drug Discov. 2005;4(6):489-499. doi:10.1038/nrd1750 [PubMed] [Crosslink]
Russmann S, Jetter A, Kullak-Ublick GA. Pharmacogenetics of drug-induced liver injury. Hepatology. 2010;52(2):748-761. doi:10.1002/hep.23720 [PubMed] [Crosslink] [Google Scholar]
Dong, X., He, J., Lin, L., Zhu, Y., Chen, C., Su, L., Zhao, Y., Zhang, R., Wei, Y., Chen, F., & Christiani, D. C. (2021). Association between aspirin use and lung cancer incidence depends on high-frequency use, bodyweight, and age in U.S. adults. Translational lung cancer research, 10(1), 392–401. https://doi.org/10.21037/tlcr-20-414 [PubMed]
Kamal A, Malik RN. Hematological Evidence of Occupational Exposure to Chemicals and Other Factors among Auto-Repair Workers in Rawalpindi, Pakistan. Osong Public Health Res Perspect. 2012;3(4):229-238. doi:10.1016/j.phrp.2012.10.003 [PubMed]
Premont RT, Reynolds JD, Zhang R, Stamler JS. Role of Nitric Oxide Carried by Hemoglobin in Cardiovascular Physiology: Developments on a Three-Gas Respiratory Cycle. Circ Res. 2020;126(1):129-158. doi:10.1161/CIRCRESAHA.119.315626 [PubMed] [PMC Full Text] [Circulation Research]
Pillai AA, Fazal S, Mukkamalla SKR, Babiker HM. Polycythemia. In: StatPearls. Treasure Island (FL): StatPearls Publishing; May 20, 2023. [PubMed]
Lewandowska AM, Rudzki M, Rudzki S, Lewandowski T, Laskowska B. Environmental risk factors for cancer – review paper. Ann Agric Environ Med. 2019;26(1):1-7. doi:10.26444/aaem/94299 [PubMed] [Full Text]
San T, Polat S, Cingi C, Eskiizmir G, Oghan F, Cakir B. Effects of high altitude on sleep and respiratory system and theirs adaptations. ScientificWorldJournal. 2013;2013:241569. Published 2013 Apr 17. doi:10.1155/2013/241569 [PubMed]
Alharthi SB, Kilani I, Solaimani HS, et al. Comparative Study of Complete Blood Count Between High-Altitude and Sea-Level Residents in West Saudi Arabia. Cureus. 2023;15(9):e44889. Published 2023 Sep 8. doi:10.7759/cureus.44889 [PubMed]
Hirshkowitz M, Whiton K, Albert SM, et al. National Sleep Foundation’s sleep time duration recommendations: methodology and results summary. Sleep Health. 2015;1(1):40-43. doi:10.1016/j.sleh.2014.12.010 [PubMed] [Elsevier]
Hamasaki H. The Effects of Mindfulness on Glycemic Control in People with Diabetes: An Overview of Systematic Reviews and Meta-Analyses. Medicines (Basel). 2023;10(9):53. Published 2023 Sep 7. doi:10.3390/medicines10090053 [PubMed]
Pascoe MC, Thompson DR, Jenkins ZM, Ski CF. Mindfulness mediates the physiological markers of stress: Systematic review and meta-analysis. J Psychiatr Res. 2017;95:156-178. doi:10.1016/j.jpsychires.2017.08.004 [PubMed] [Elsevier]